
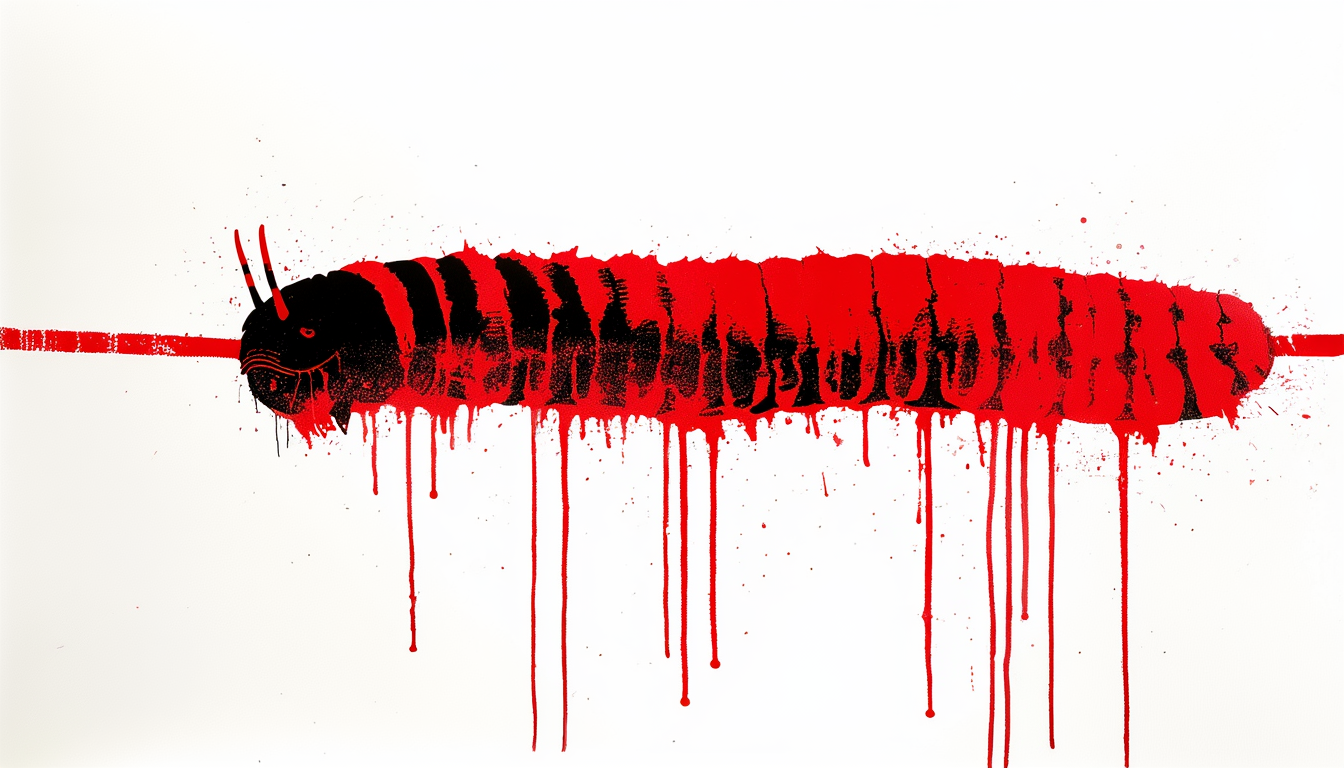
The string at Banner Elk is three feet long and it runs straight up. Avery County has been racing caterpillars up it every October since 1978, and the winner is crowned the official forecaster of the winter and its owner is paid a thousand dollars. The rule the winner is read against is printed, old, and specific.
Roy Krege, who volunteered at the festival, told the State Climate Office of North Carolina that the winning worms had been "correct 84.5 percent of the time."1
Black means a hard winter. Orange means a mild one. Thirteen segments, thirteen weeks of winter.
What would have to be true
Take it at full strength, because at full strength it is not a stupid proposition and the people running the string are not fools.
An insect larva is an unusually good thermometer. Development in Pyrrharctia isabella runs on accumulated heat, not on calendar days, so a caterpillar's condition in October is a physical integral of every warm hour it has lived through. That part is sound. If autumn heat were coupled to winter severity through something persistent, soil moisture, a blocking pattern, the state of the Pacific, then a larva's stage in October would carry genuine information about December. Phenological signals of exactly that shape do work. A ring around the moon means rain because the ring is cirrus running ahead of a warm front, and the front is coming whether anyone looks up or not.
The animal also has something at stake. The banded woolly bear does not pupate before winter. It overwinters as a larva under leaf litter, running glycerol as an antifreeze, and takes the cold directly on its own body.2 Selection has had every reason to make this animal good at winter.
So the question is not whether the caterpillar knows anything. It is what the band is a measurement of.
What the rule is measuring
The band is a growth record.
A woolly bear molts six times before it reaches full size, and with each molt it comes out less black and more reddish.3 The orange through the middle widens as the animal ages. A worm with a wide band is a worm that got going early, fed well, and put a long season behind it. A worm with a narrow band started late or ate poorly or both.
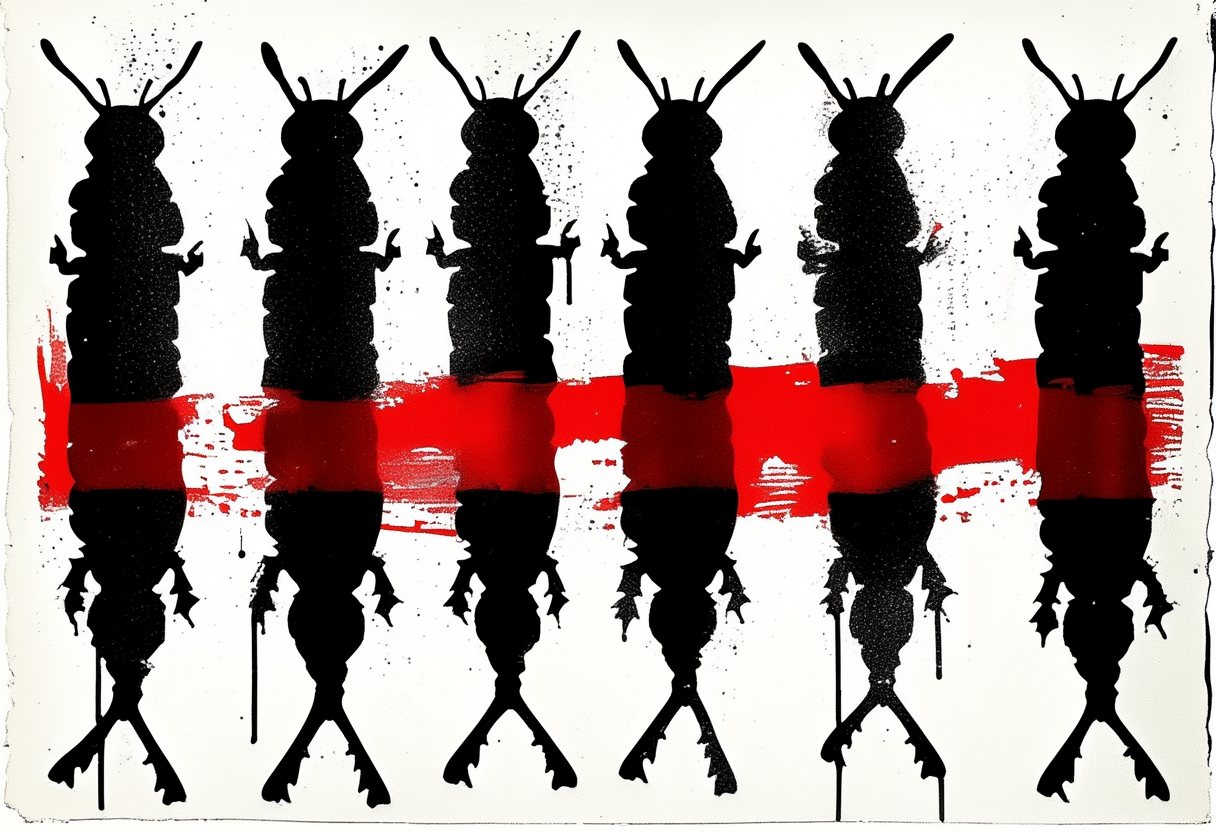
Figure 1. Band proportion as a function of instar, drawn from the published molt sequence rather than from measured specimens.
That makes the band a record of the spring and summer that just ended. It is honest data about April.
Two further things sit on top of it, and both make the instrument worse rather than better. There are roughly 260 species of tiger moth in North America and each carries a slightly different pattern, so a worm picked up off a road in Avery County is not necessarily the species the rule was written about.3 And the debunking literature does not agree with itself on the sign. The National Weather Service writes that each successive molt leaves the animal less black and more reddish, and then, four sentences later, that a better growing season produces a bigger caterpillar with narrower red-orange bands through the middle.3 Those two sentences cannot both set the arrow the same way.
I don't have a good answer for that. What I can say is that an instrument whose own critics disagree about which way it reads is not an instrument anybody should be scoring a season against.
Which way it points, and against what
Backward, and against nothing.
The accuracy claim is the part worth measuring, because it is the part that gets repeated. The State Climate Office checked the festival winners against the record and found them right between forty and fifty percent of the time, which for a binary call between a mild winter and a harsh one is the coin.1 Krege's 84.5 percent and the measured forty to fifty are not a disagreement about caterpillars. They are a disagreement about what a forecast is scored against.
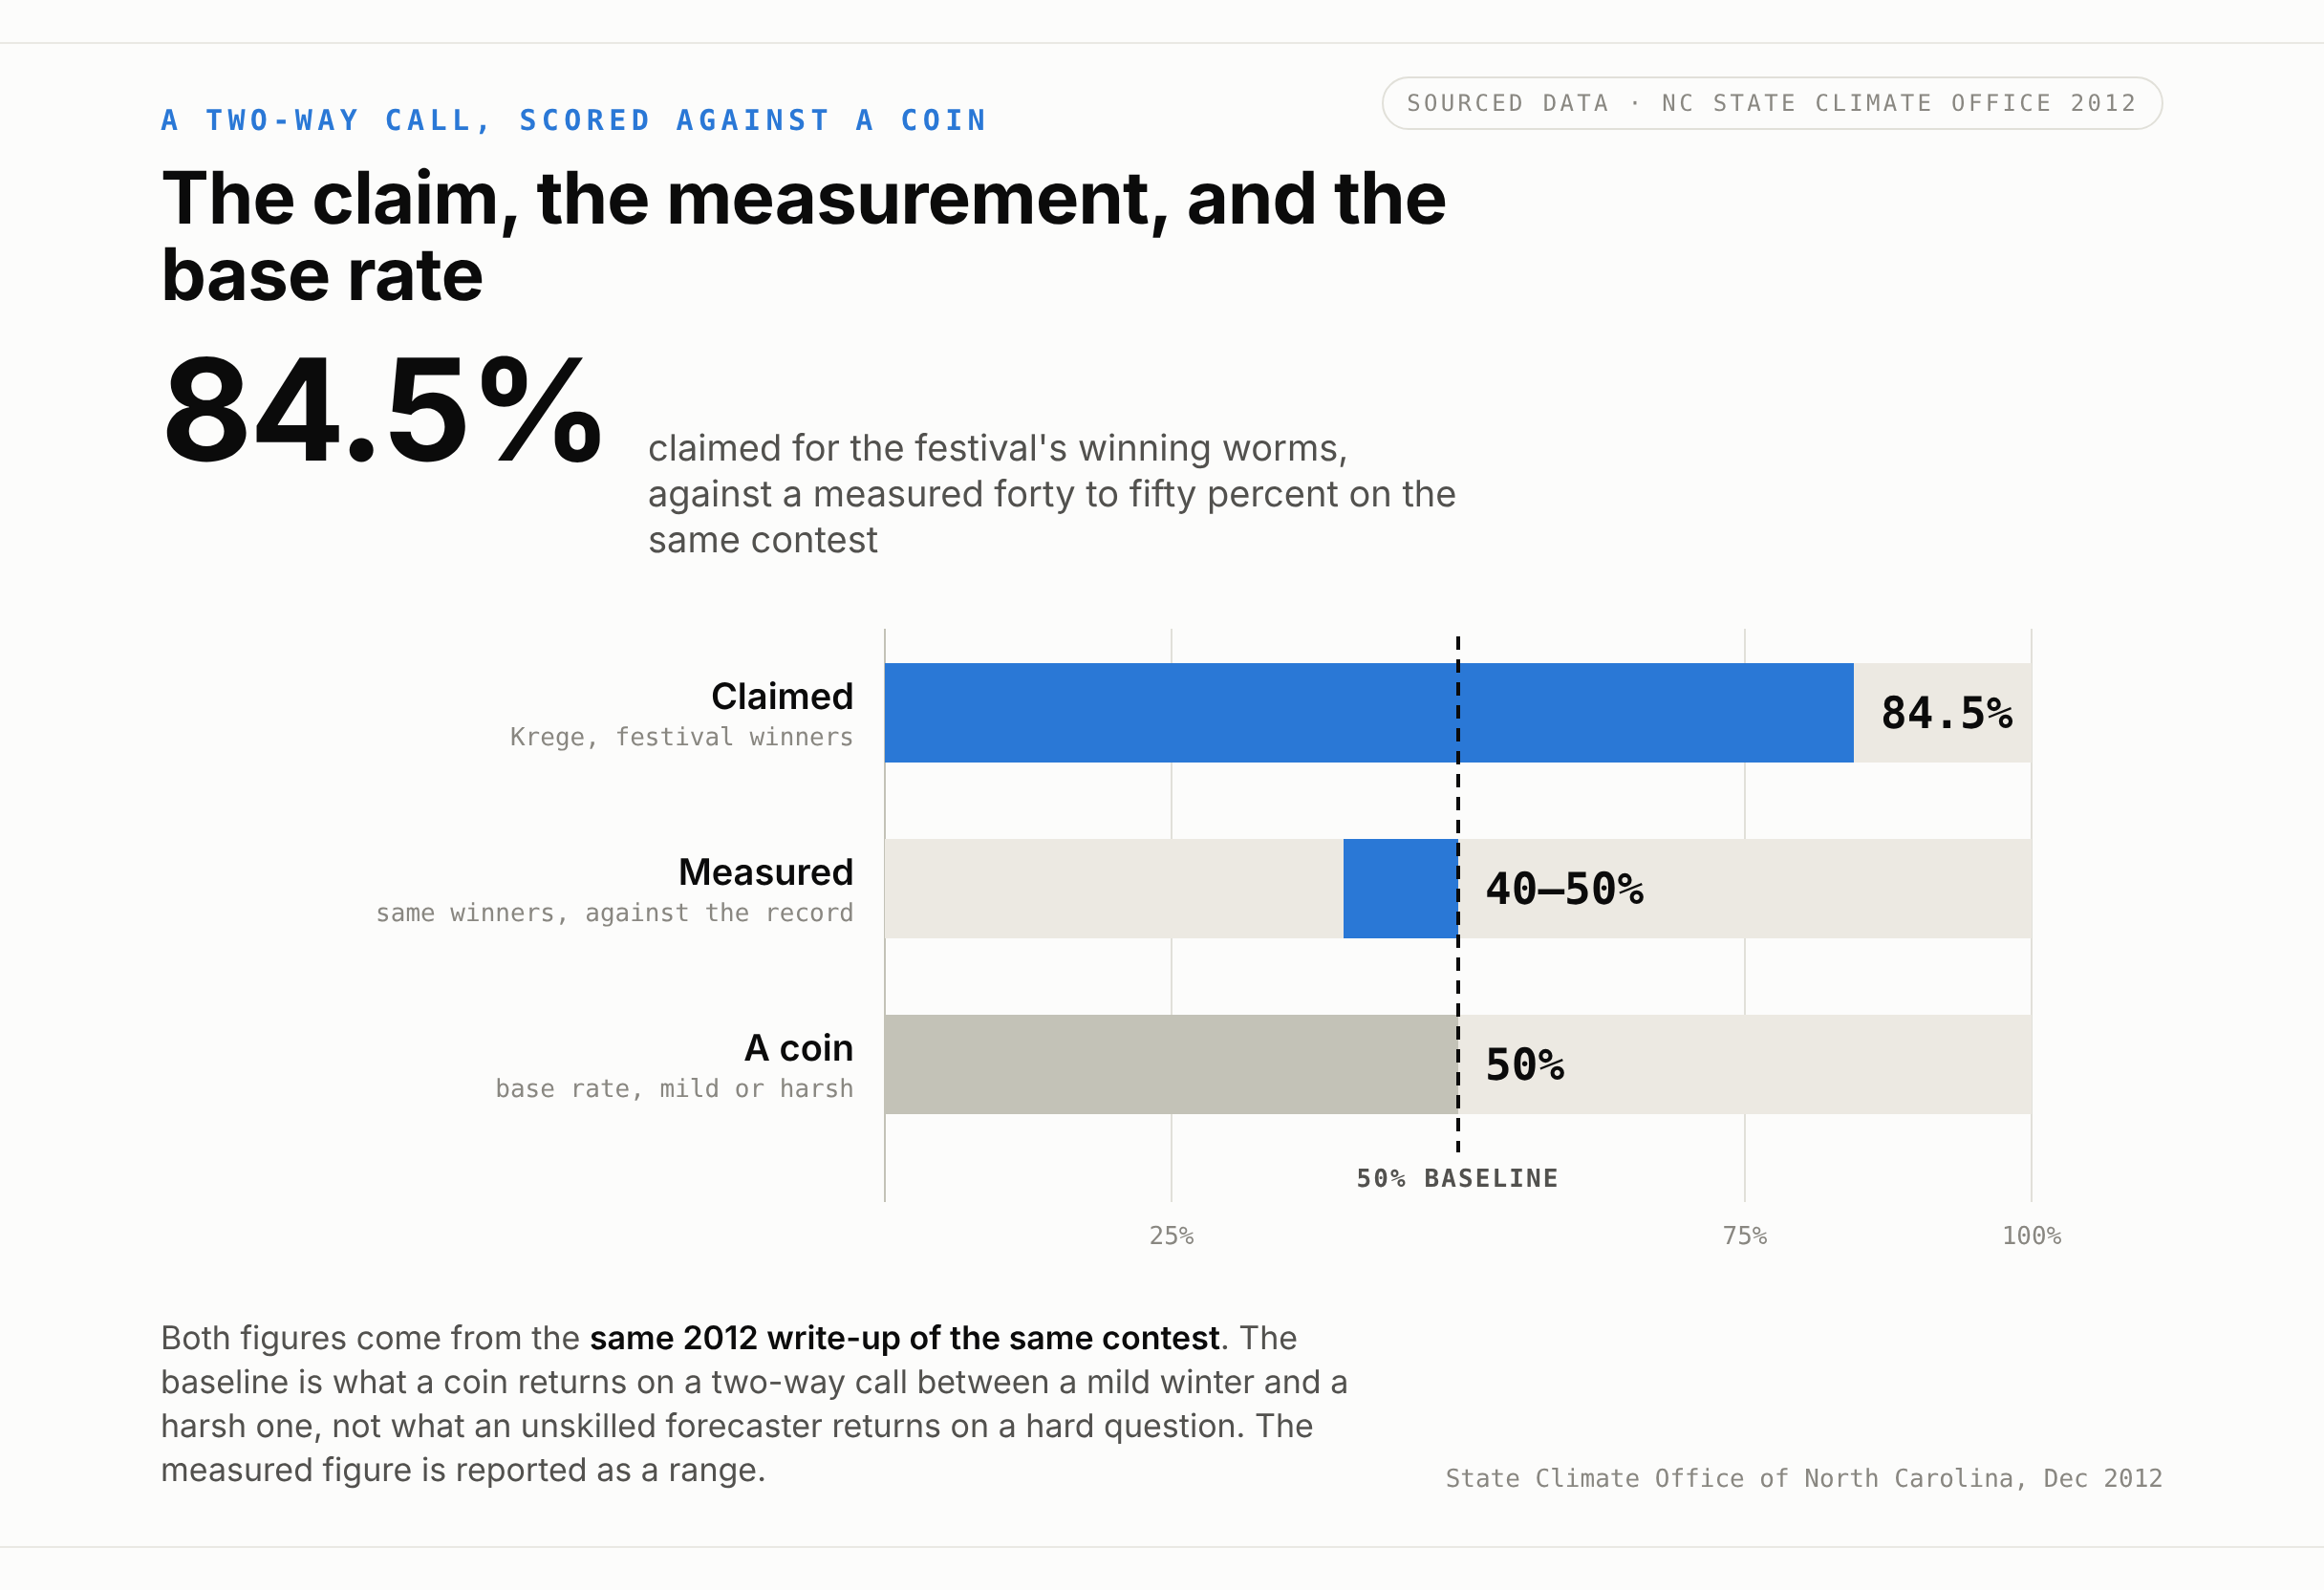
Figure 2. The claim, the measurement, and the base rate. The baseline is what a coin returns on a two-way call, not what an unskilled forecaster returns on a hard one.
The man who put the rule into the newspapers had the same problem and was more honest about it. C. H. Curran, curator of insects at the American Museum of Natural History, drove forty miles north of New York City to Bear Mountain State Park in the fall of 1948, collected as many caterpillars as he could in a day, counted segments, and gave the result to the New York Herald Tribune. He kept at it for eight more seasons under the banner of the Original Society of the Friends of the Woolly Bear. Across 1948 to 1956 his average brown-segment counts ran from 5.3 to 5.6 out of thirteen.4
Nine seasons. Three tenths of a segment of total swing. Whatever those nine winters did, and they did not all do the same thing, the instrument did not move.
Curran never claimed he had settled it.4 He was a man with a day's collecting and a number, and he said so.
The live one
The same error is running now, with better instruments, and the people running it are not fools either.
A lead time is the number of weeks between placing a chip order and taking delivery of it. Susquehanna Financial Group tracked the figure, Bloomberg published it, and through the shortage years it was treated as the read on semiconductor demand. In May 2022 it reached 27.1 weeks, the longest on record. By that October it was 25.5.5
May 2022 was also the month Jefferies told clients to expect a sharp inventory correction, with earnings cuts worse than the 2016 or 2019 downcycles, and named the cause as "the level of shortage, double ordering and overheating of the industry." PC inventory had gone from 52.7 days in December to 62.1 in March and was headed past seventy.6
By August the shortage was a glut. Global semiconductor inventory had gone from about 1.2 months of production in February to 1.7 months in July, Gartner had cut its 2022 growth forecast from thirteen percent to seven and was projecting a 2.5 percent contraction for 2023, and Christopher Danely at Citigroup was calling the worst downturn in at least a decade.7
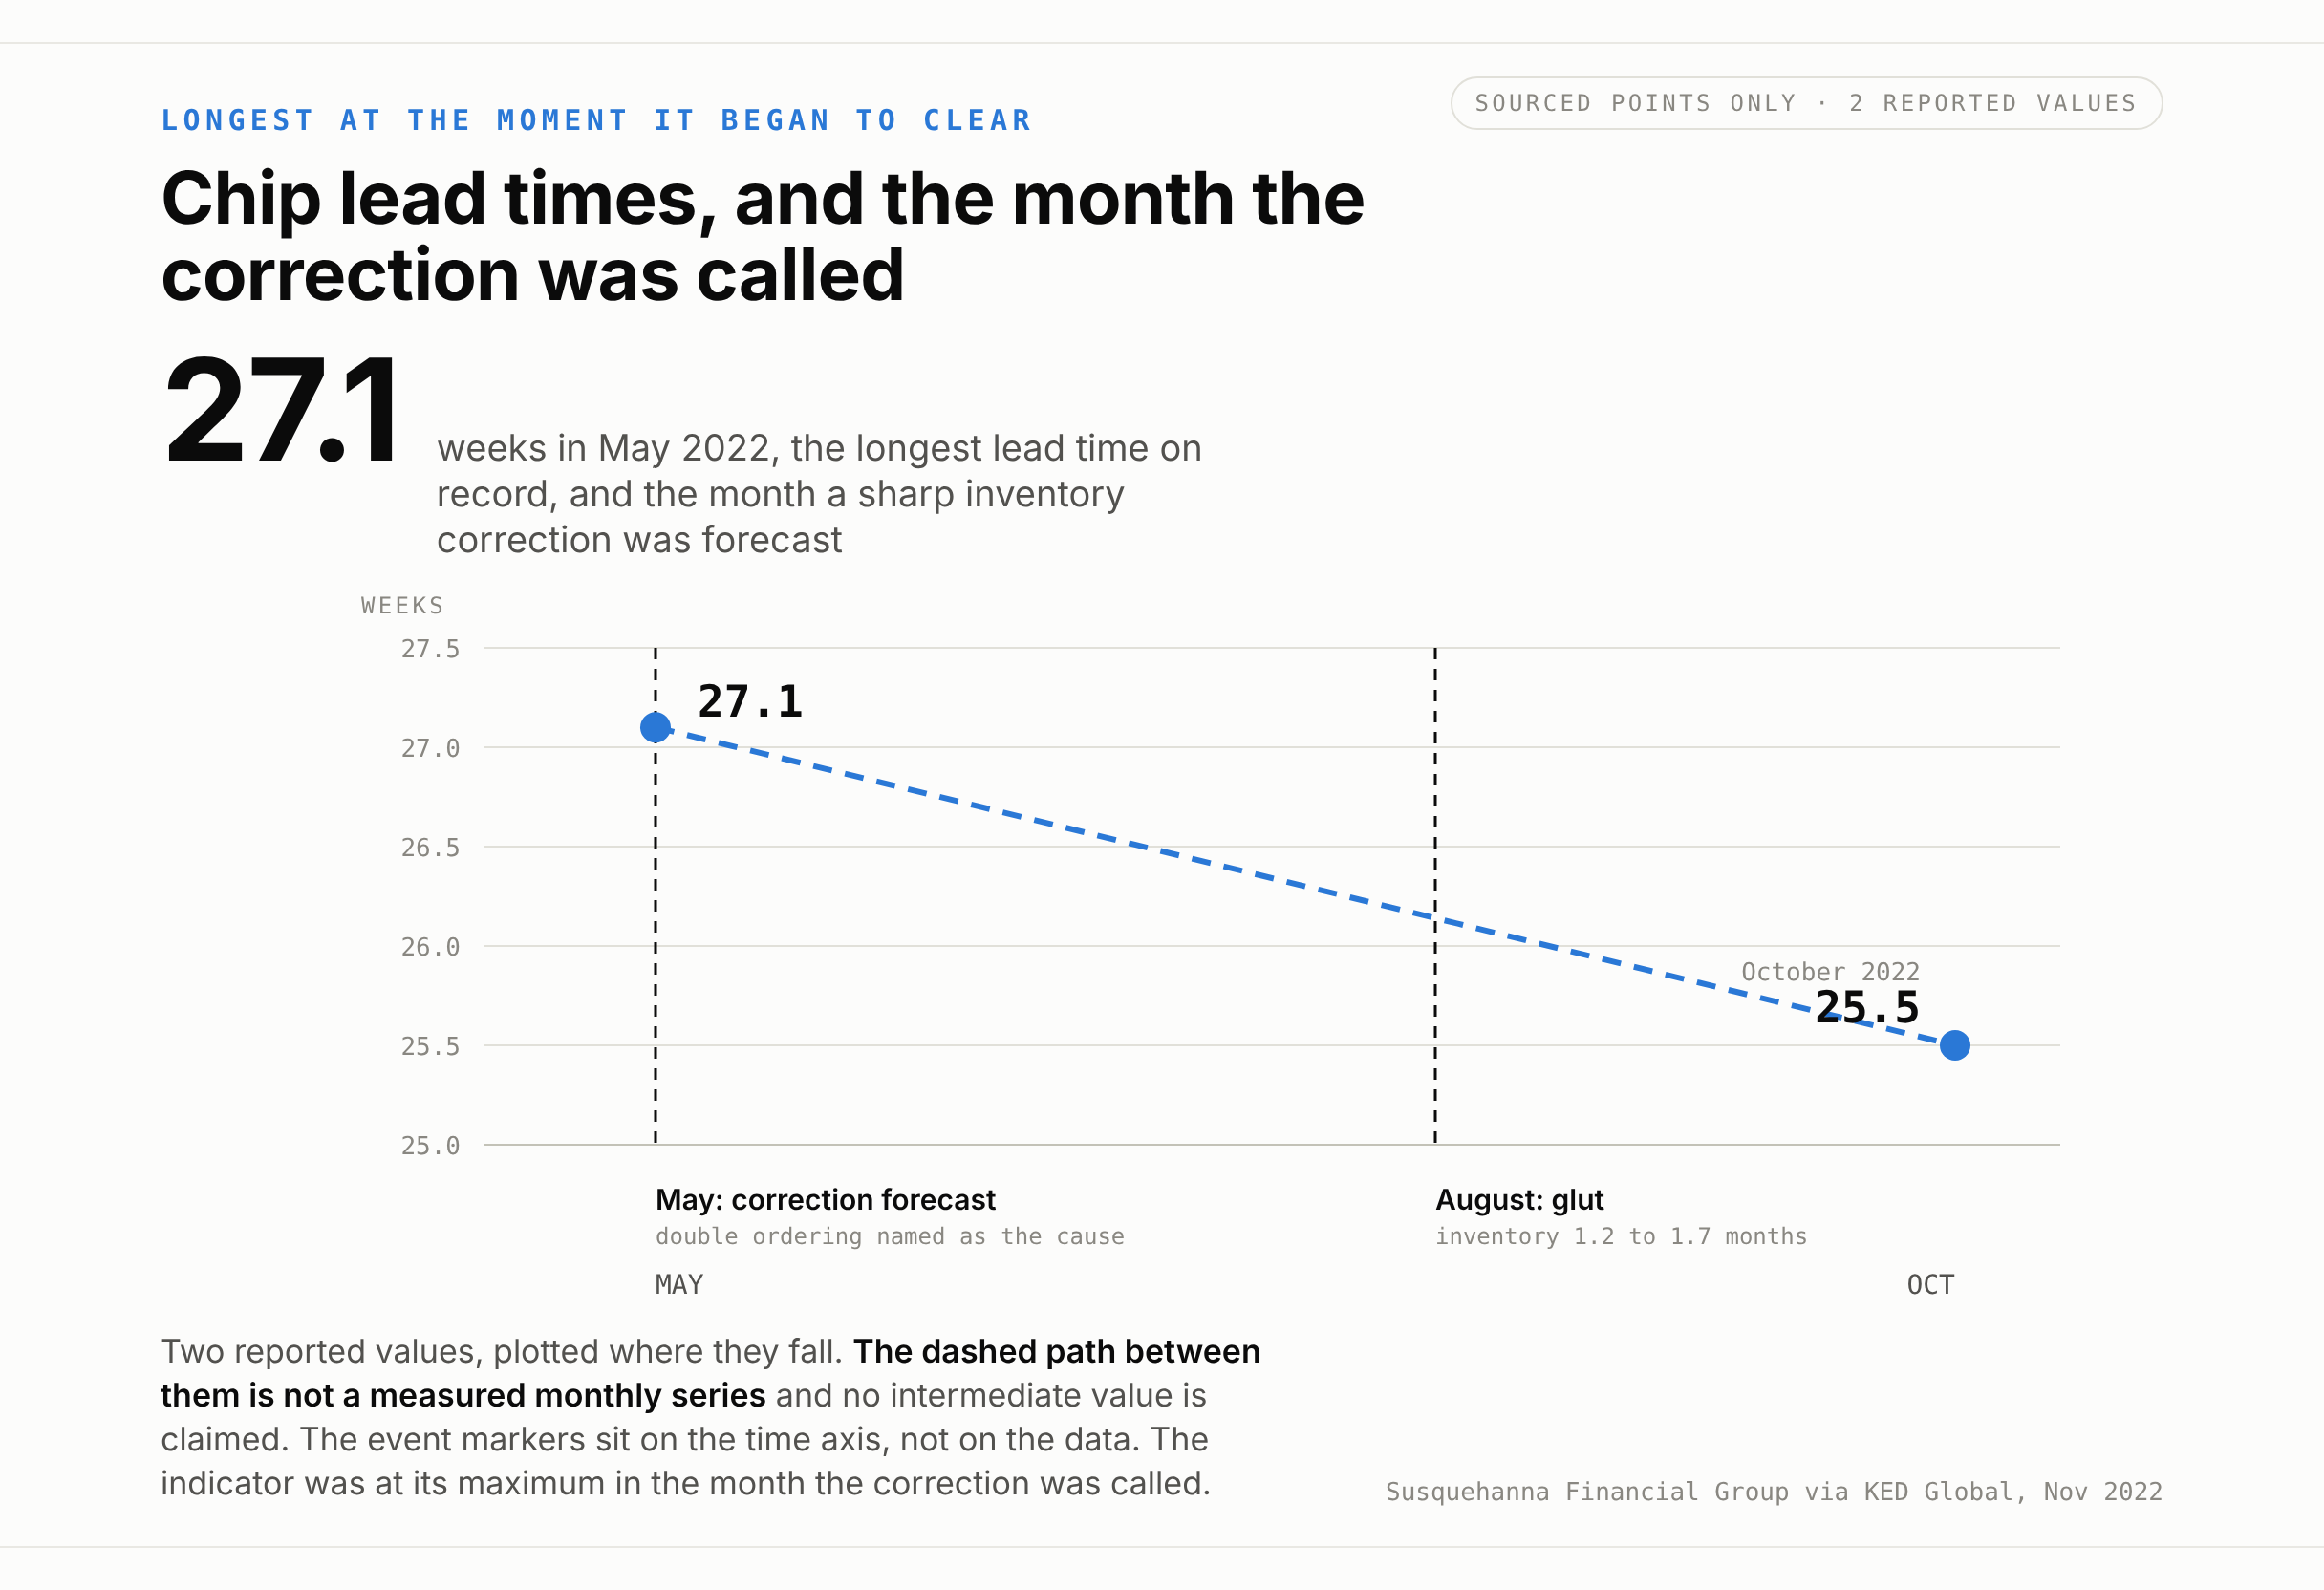
Figure 3. The two reported values, and the month the correction was forecast. The indicator stood at its record maximum in the month the queue began to clear.
The indicator was not broken. A lead time is a real, honestly reported measurement of a queue, and the queue was real. It is a measurement of orders already placed, including the ones placed twice by buyers who had learned not to trust their allocation. Double-ordering is the part that makes the reading worse the more people rely on it, because every duplicate lengthens the queue that persuaded someone to duplicate. It lengthens on demand that has already happened. It is longest at the moment the queue is longest, which is the moment the queue begins to clear.
A lead time is an age.
So is a band.
Editor's note. Category: wrong arrow. Filed to the Almanac desk. Roy Krege's accuracy claim and the forty to fifty percent measurement are both taken from the State Climate Office of North Carolina's 2012 write-up of the Banner Elk festival; Krege is quoted there and was not re-interviewed for this piece. The internal contradiction in the National Weather Service page is reported as found and is not resolved here. Curran's segment counts are the published figures, not a reanalysis. The 2022 chip-cycle figures are contemporaneous reporting.