

The Wal-Mart lot in Ocoee, Florida was full on the day in January 1989 that John Huey walked it for Fortune. The K mart down the street was not. He wrote both down.
Huey described what he saw this way: "The parking lot is full; the K mart lot down the street is about half full."1
Then he went inside and compared the advertised prices, which is the part nobody quotes.
What would have to be true
Take it at full strength, because at full strength it is not a careless way to size up a store and the people who have used it for a century were not careless.
A car in a lot is a household that got in a vehicle, burned fuel, and drove somewhere to spend money. Nobody does that by accident. A count of cars is therefore a census of revealed intent rather than a survey of stated intent, it costs nothing but attention, and it can be taken as often as you like without anyone's cooperation. It is also old practice rather than lore. Richard Hurd's 1903 textbook on city land values set out the doctrine in a chapter heading: retail stores chiefly located by currents of travel.2 By 1965 the American Society of Planning Officials was publishing it as method, listing among the uses of a pedestrian count the instruction to select retail store locations on the basis of pedestrian movement past prospective locations, and to determine downtown retail property values on the basis of pedestrian traffic volumes.3
So the question is not whether a full lot means anything. It is what the count is a count of.
What the rule is measuring
Arrivals.
That is the whole of it. A lot count returns the number of households that showed up. To turn arrivals into money you need two more numbers: the share of arrivals who buy anything, and the dollars each buyer spends. Neither of those is in the photograph, and neither of them holds still.
The first one moves with the staffing. Working from an apparel chain's store-level records, Olga Perdikaki and colleagues decomposed sales into conversion rate and basket value and found that sales show diminishing returns to traffic, and that conversion rate falls as traffic rises. At average traffic and average labor, one additional unit of hourly traffic was worth about $9.97 in hourly sales. Raise the labor on the floor by one standard deviation and that same additional unit of traffic was worth $11.32.4 The same car in the same lot is worth about thirteen percent more money on a day when the store rostered more people. The multiplier is a function of the rota.
The second number has a well-documented cousin in the corn trade, and the arithmetic is worth borrowing. Bob Nielsen at Purdue publishes the standard yield estimate: measure a thousandth of an acre of row, count the harvestable ears, count kernels on every fifth ear, multiply, then divide by a kernel-weight figure he calls a fudge factor. The inherited factor is 90, meaning an assumed ninety thousand kernels to the bushel. Nielsen's own warning is that kernel weight for the same hybrid can easily vary by twenty thousand kernels per bushel or more from year to year, and that recent trial averages ran about seventy six thousand, with a range from sixty seven to ninety four thousand. Run one count of thirty ears at 511 kernels through factors of 65, 75 and 85 and you get 236, 204 and 180 bushels to the acre.5 One count, a fifty six bushel spread, and the spread is entirely in the constant.
Which way it points
Against a baseline, not against nothing.
The best scoring anyone has done on lot counts used RS Metrics satellite fill rates for forty four American retailers from 2011 through 2017, 4.7 million daily store-level observations across 67,078 locations. The correlation between year-over-year fill-rate growth and year-over-year same-store sales growth was about 0.38. A one standard deviation rise in fill-rate growth went with roughly eight tenths of a percentage point of same-store sales growth. The instrument moves with its target and explains well under a sixth of its variation.6
The same paper reports something sharper, which is that the arrow is lopsided. The coefficient on falling fill rates is nearly three times the coefficient on rising ones. The lot tells you much more when it is emptying than when it is filling. The authors also list what their pictures cannot see: about fifty eight percent of each retailer's stores, domestic locations only, surface lots only because underground and multi-storey parking do not appear from above, and one snapshot per pass, usually late morning to early afternoon, through whatever cloud, haze, tree cover and shadow happen to be there.6
The live squirrel
The count is now bought from orbit, and it is making the same error with better pictures.
Orbital Insight sold retail car counts to investors through the second half of the 2010s. Its published read on J.C. Penney was minus five percent year over year in the fourth quarter of 2016, which the company's own post paired with a reported 0.7 percent decline in store sales. By late February 2017 the satellite read for the first quarter was minus ten percent.7 J.C. Penney reported that quarter in May: comparable store sales down 3.5 percent.8 Early, directionally right, and off by a factor of three. It is a sign, not a number, and it was being sold to people who needed a number.
What it was worth is on the record. The three-day factor-adjusted return around earnings ran 1.66 percent on the buy side and minus 3.10 percent on the short side, a spread of 4.76 percent, and the paper puts the cost of access at hundreds of thousands of dollars a year.6
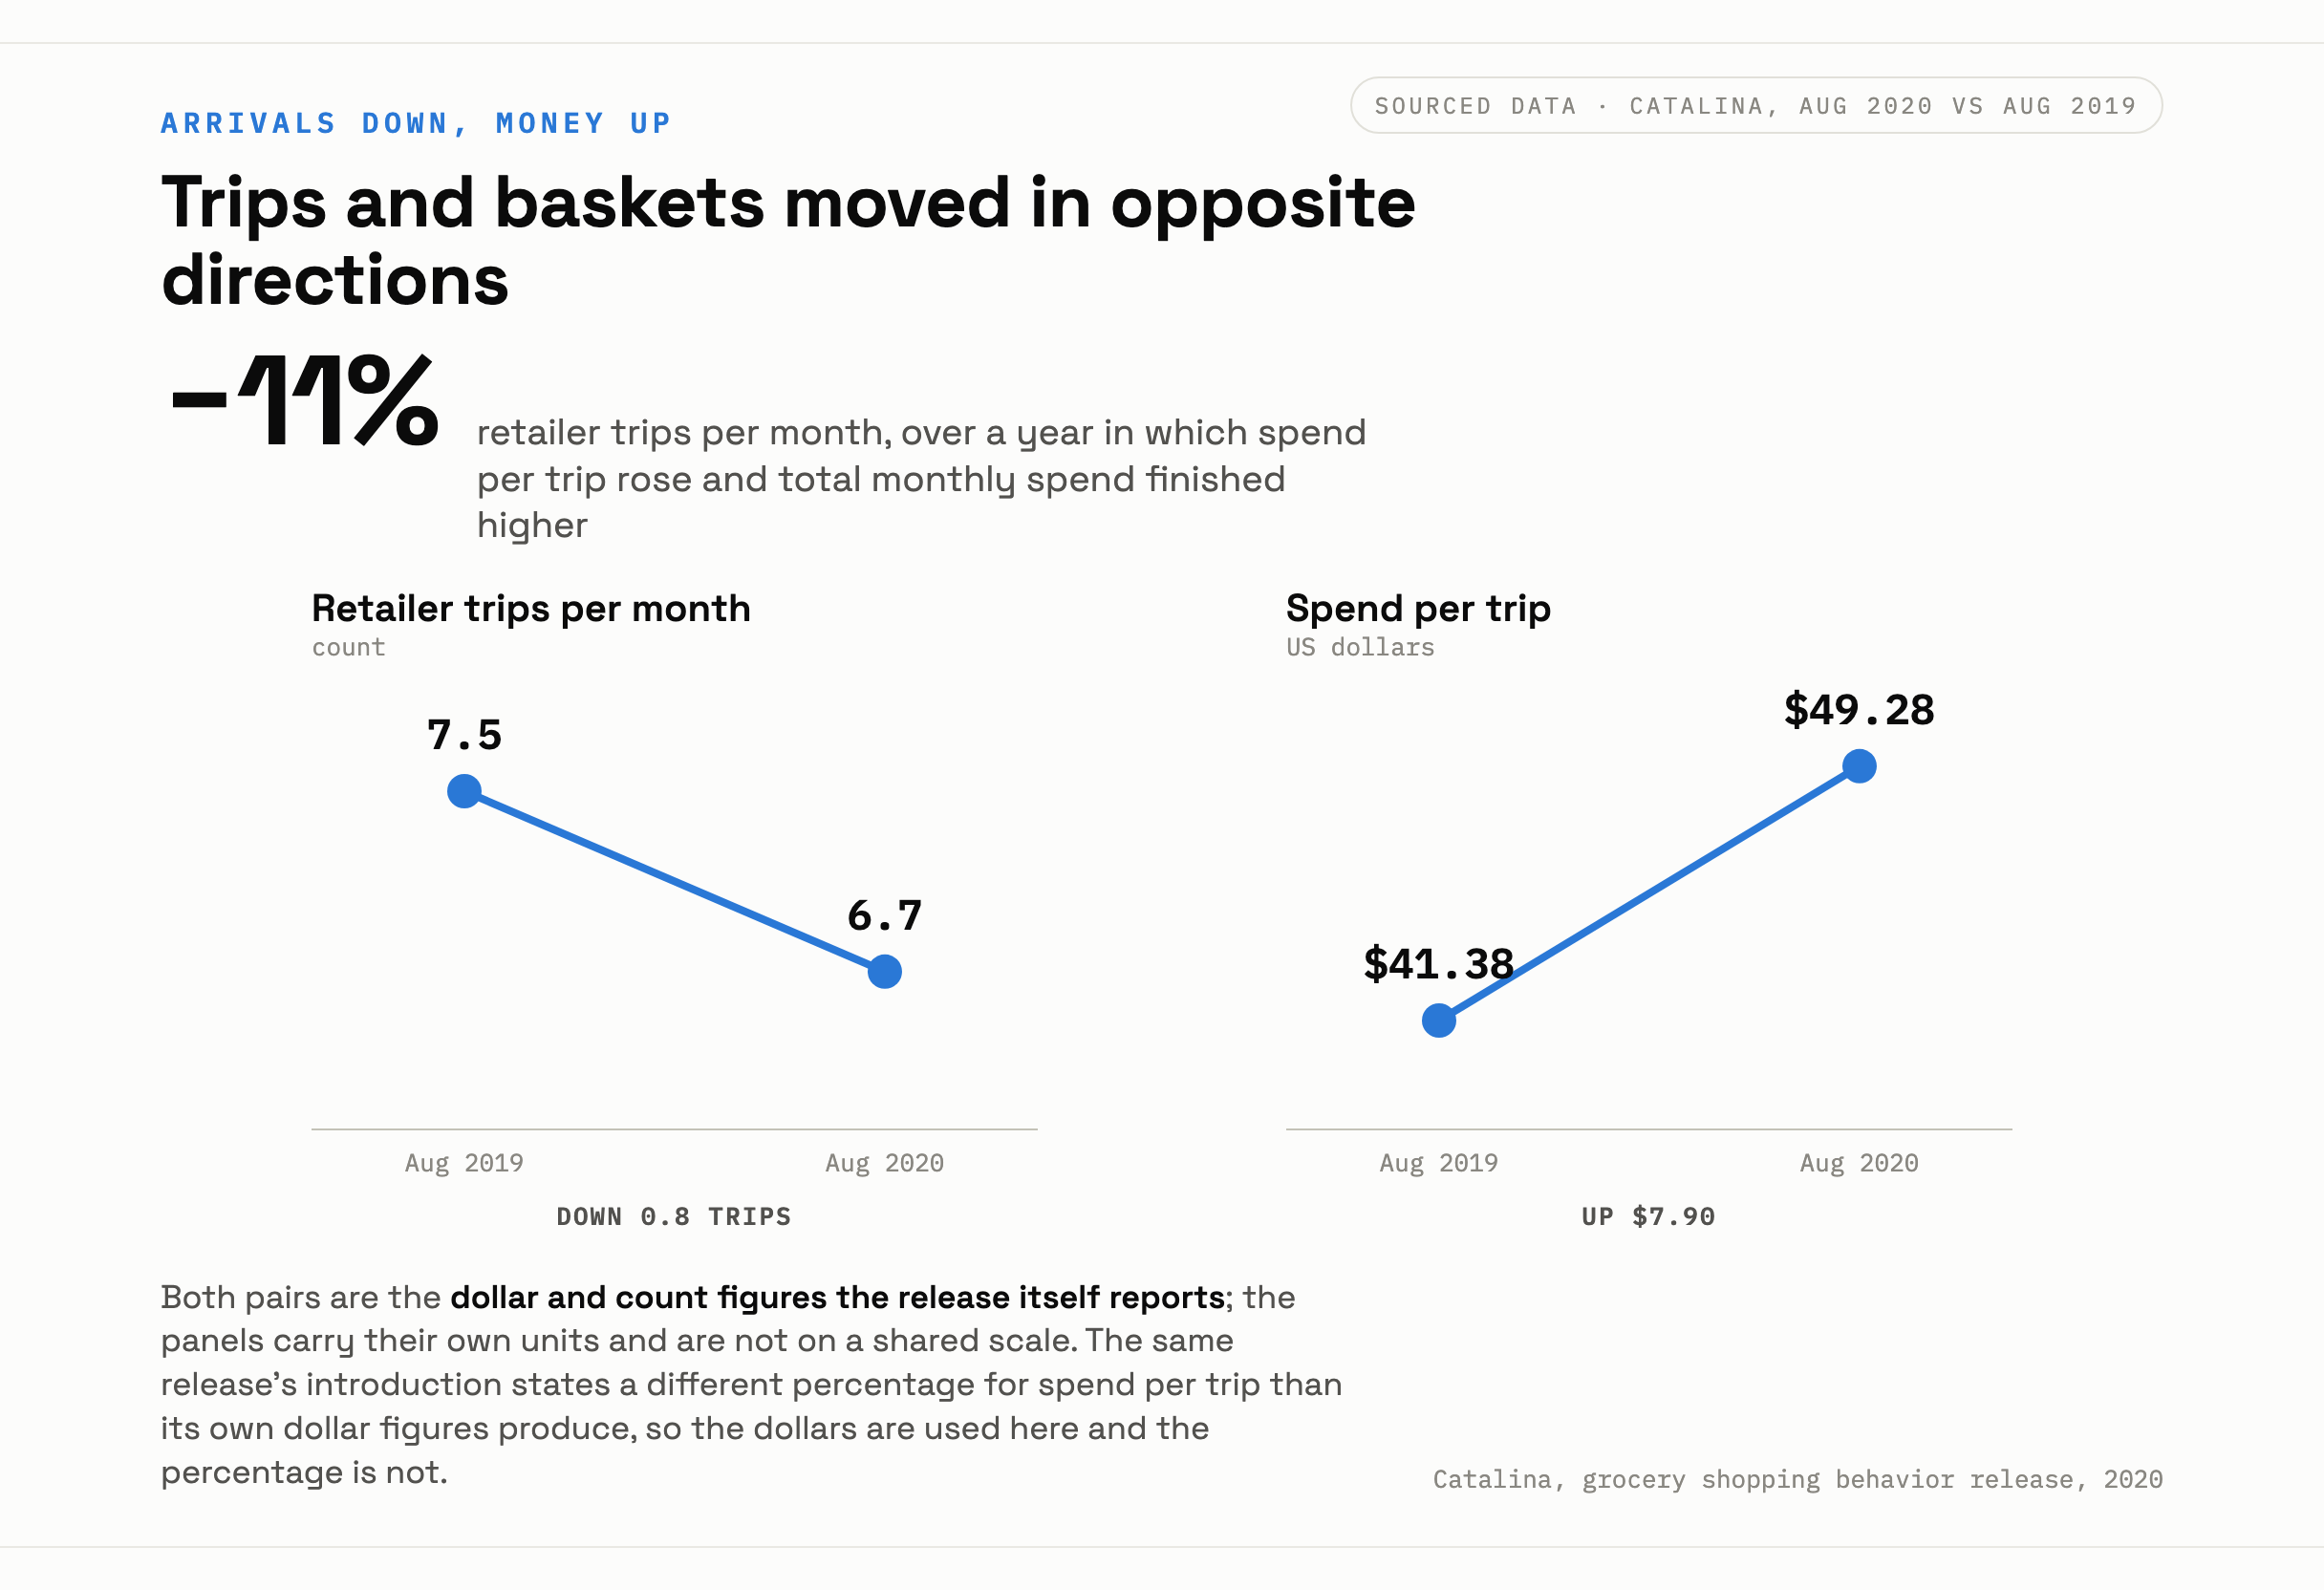
Meanwhile the ratio the whole thing depends on came apart in public. Catalina's grocery figures for August 2020 against August 2019 show monthly retailer trips falling from 7.5 to 6.7 while spend per trip rose from $41.38 to $49.28, which left monthly spend higher than the year before.9 Arrivals down about a tenth, money up. A car counter would have shorted it.
And the trade has been leaving the lot for twenty five years. US retail e-commerce was 0.6 percent of total retail sales in the fourth quarter of 1999 and 17.1 percent in the second quarter of 2026.10 The Census counts a sale as e-commerce by where the order was placed, so a curbside pickup is already counted as online while still putting a car in the bay, and a home delivery is revenue with no arrival at all. Both wedges widen the gap between the count and the till, in opposite directions.
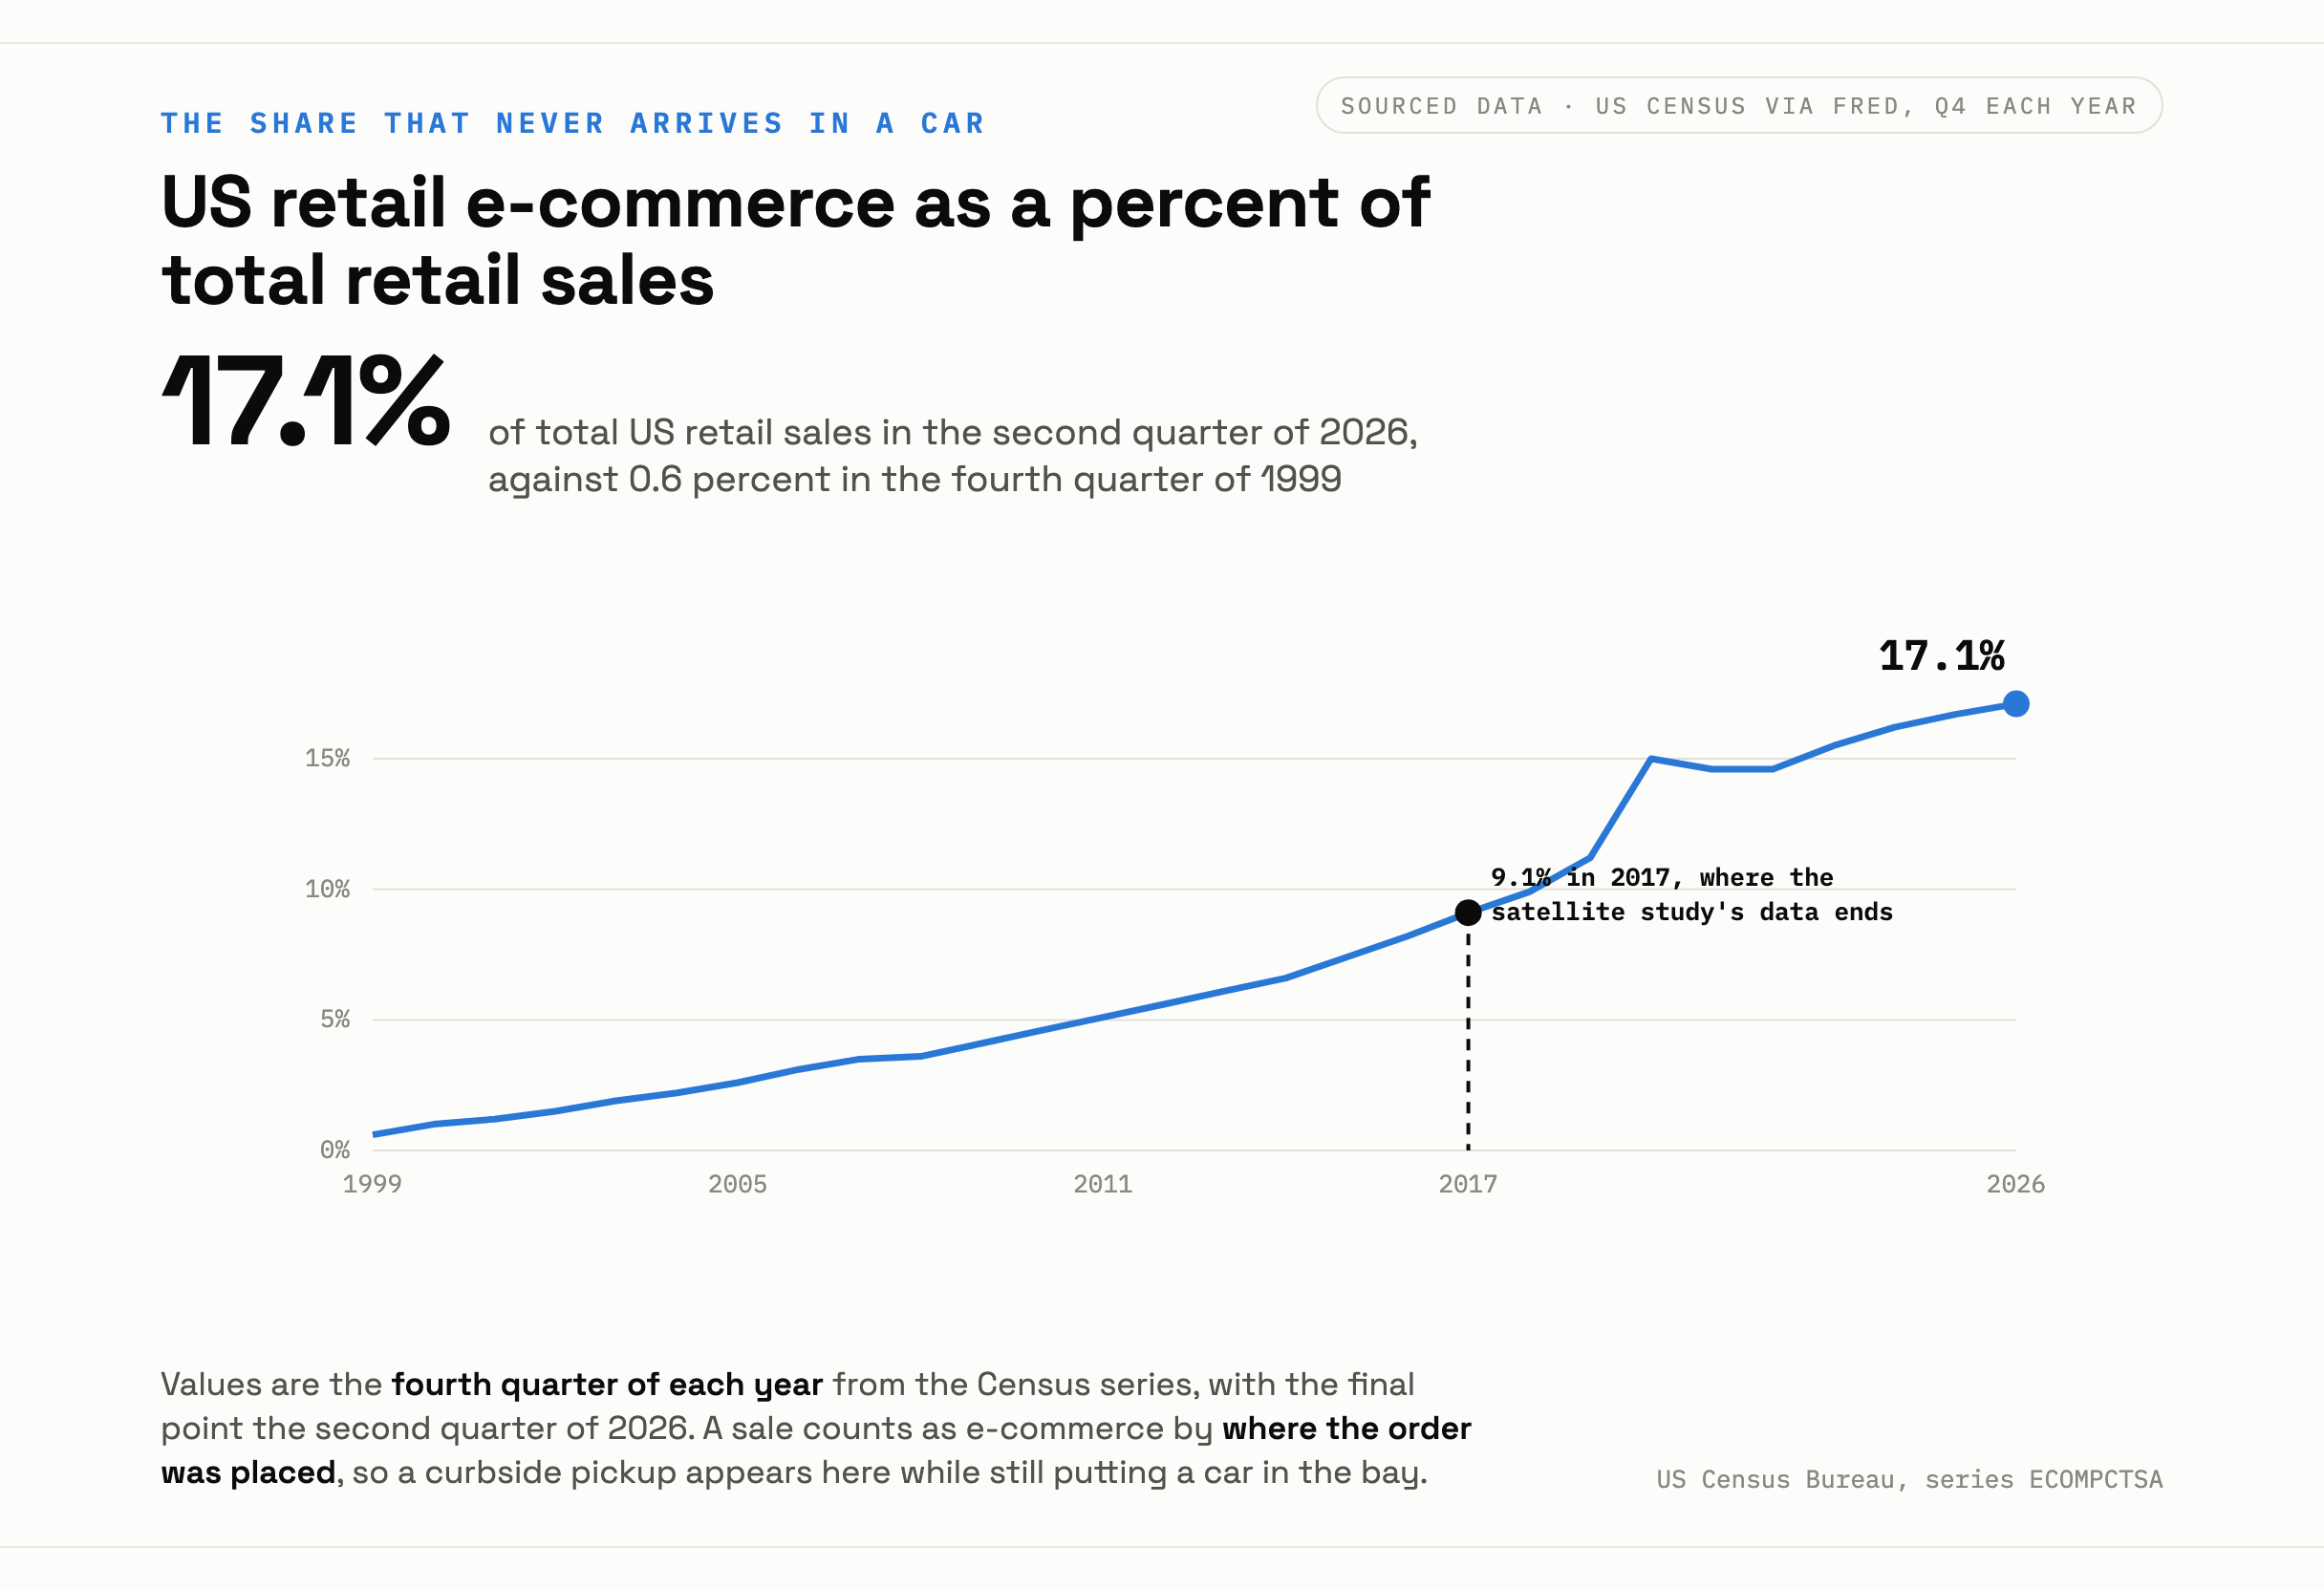
The satellite study ends in 2017. E-commerce was about nine percent of retail that year and it is seventeen now, and nobody has re-run the correlation against the second number. I don't have a good answer for what 0.38 would be today. It is the measurement I would most like to have and it does not exist.
A count of arrivals is a count of arrivals. It becomes money through a conversion rate set by who is working the floor and a basket size set by how often the household shops, and neither of those is in the frame. Huey knew exactly what he had in Ocoee: one full lot and one half-full lot, side by side, on the same afternoon, in the same town. He did not multiply it by anything.