
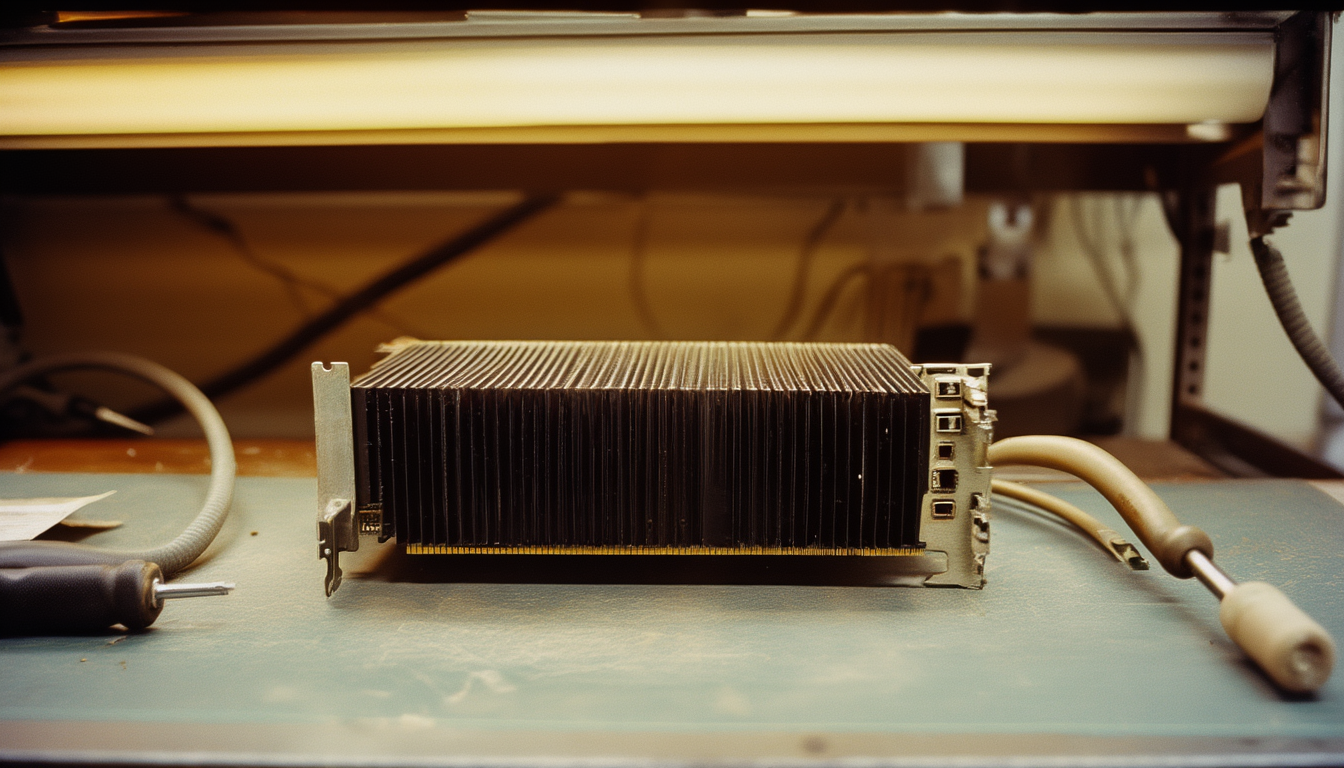
The card is about the length of a forearm, black, finned, and heavy in a way that surprises people who have only seen one in a diagram. This one went on sale in 2020. By late 2026 it was renting for at or above what it had cost at the start of that year, which is the part that was not supposed to happen.1 Compute is the one industry where everybody agrees about depreciation. Chips get faster, the old ones get displaced, and the rental price of last generation's silicon falls on a curve reliable enough to borrow against. A six-year-old accelerator holding its price is a small fact, and in 2026 it was doing a great deal of work.
The firm that published the observation put it plainly, under a chart heading noting that reports of GPU obsolescence had been greatly exaggerated. The same report found that technology contributed roughly 76% of the S&P 500's entire earnings growth in 2026 as of late August, and that tech earnings had grown 3.8 times more than non-tech since 2023.1 Those two facts were usually presented together, and the reading was straightforward. Demand for compute was outrunning supply so thoroughly that even obsolete hardware stayed booked, and the earnings were the proof.
Earnings that concentrated invite a second look, and the independent tallies obliged. FactSet put blended second-quarter growth for the index at 50.4%, the highest since 2021. Strip out Alphabet and Amazon and the same quarter reads 32.0%, because those two contributed something like eighteen percentage points of it, and a substantial part of their contribution came from other income rather than from operations.3 Gains on investments are real money and they are not the same thing as a product selling. An index whose headline growth depends that heavily on two companies, and partly on the non-operating line of those two companies, is reporting something more specific than an economy discovering a new source of demand. It is reporting that a small number of very large balance sheets had a good year, some of it by owning appreciating things.
Underneath all of this sat an assumption doing more structural work than anyone discussed, which is how long these assets earn. A depreciation schedule looks like an accounting formality. It is actually a discipline. It sets how fast an asset is assumed to stop paying, and from that follows how much can be borrowed against it, over what term, and how soon the whole thing has to be replaced. Shorten the assumed life and the arithmetic turns conservative on its own. Lengthen it, or let the residual value hold where it was, and the brake comes off without anyone deciding to release it.
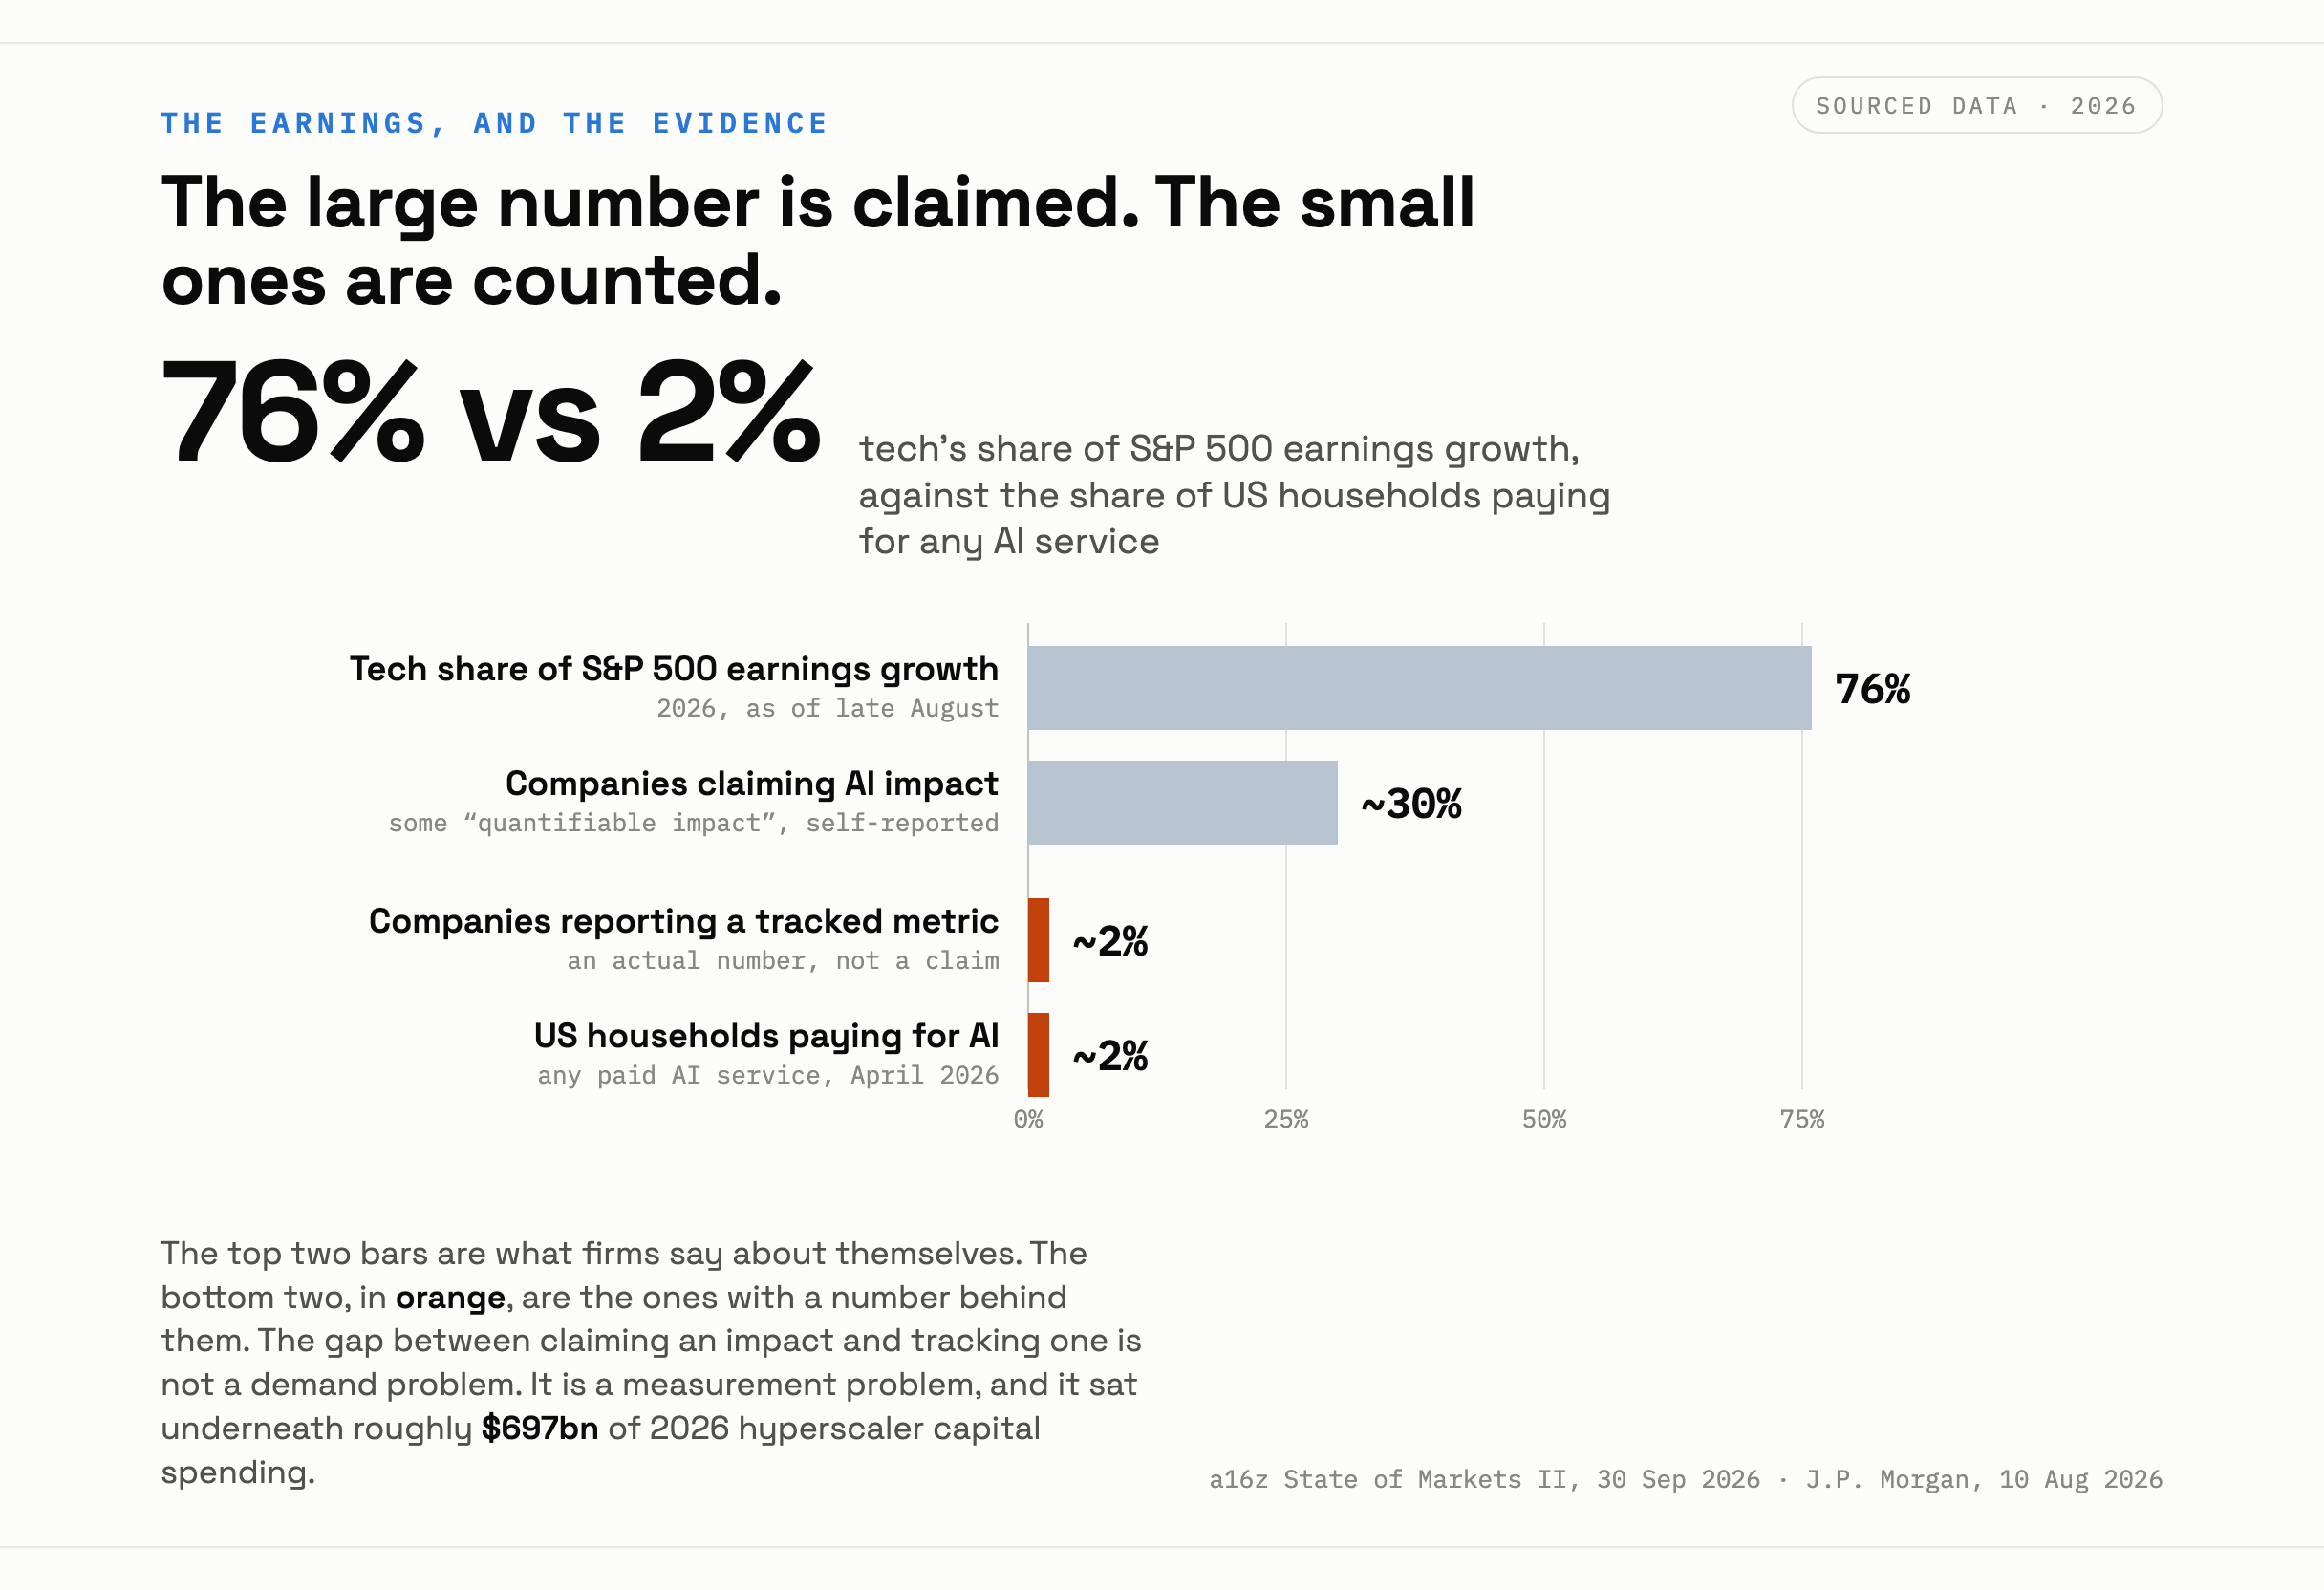
Figure 1. The 2026 figures as published, read back from 2036. The two small bars are the measured ones.
The brake came off at scale. J.P. Morgan put 2026 capital spending by the five largest U.S. hyperscalers at $697 billion, a figure that had risen $173 billion since the start of that same year.2 Historically massive profits funded a great deal of it, and increasingly debt funded the rest.1 The financing structures are where the depreciation assumption stopped being abstract. One high-performance data centre reached the bond market at a 95% loan-to-cost ratio, the highest recorded for the category, at the tightest spread, against a fifteen-year triple-net lease.2 Read that slowly. Ninety-five percent borrowed, on a building full of equipment with a contested useful life, on a lease longer than the entire history of the hardware class inside it.
None of which is self-evidently a mistake, and the bullish case deserves better than the treatment it usually gets. The rental price was real, not a narrative. Demand genuinely did outrun supply for years. And the history of infrastructure overbuild is not a history of pure waste: the railway mania of the 1840s ruined its investors and left Britain with a rail network, and the fibre laid into the ground around 2000 was lit, eventually, by companies that had not existed when it was buried. Capital cycles that look insane from inside can leave behind assets that outlast the firms that financed them. A buildout can be a bad trade and a good inheritance at the same time, and people arguing about which one it is are often not disagreeing about facts.
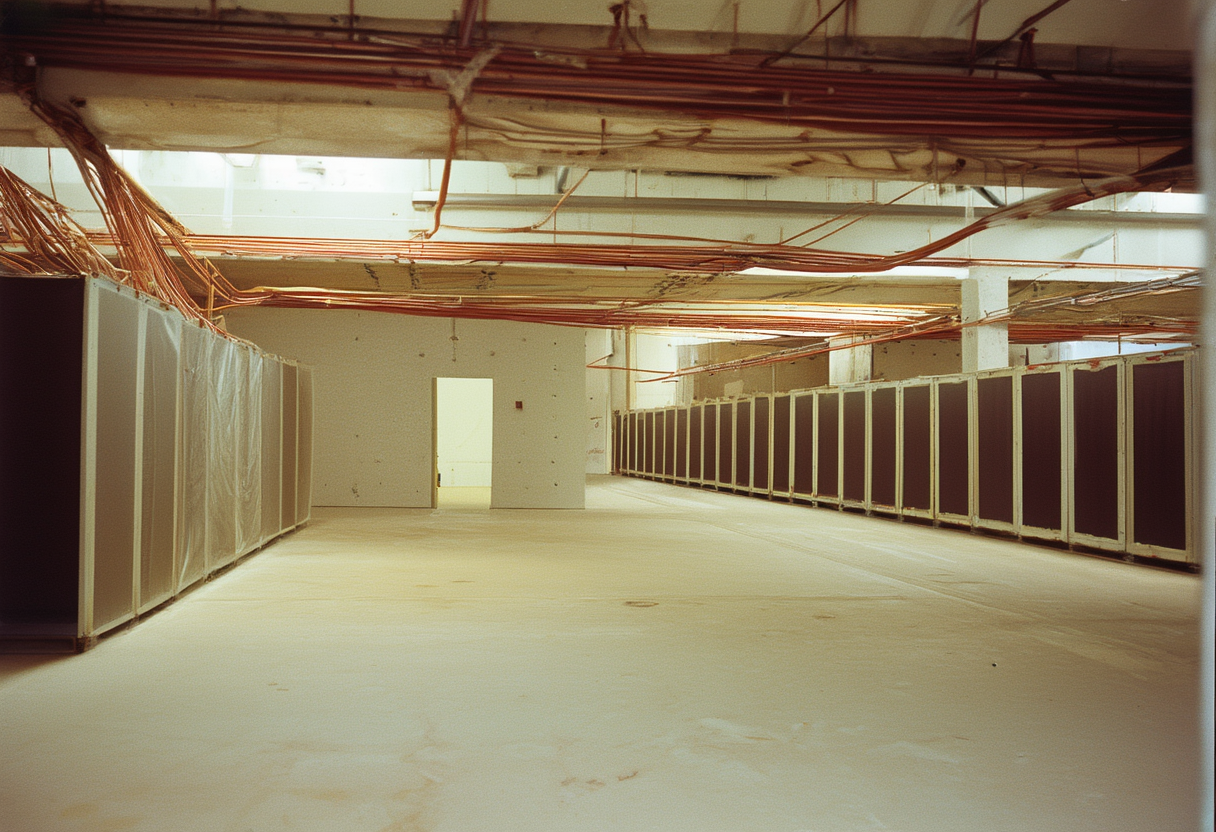
Figure 2. Shell capacity outside Abilene, Texas, photographed in 2036. Some of it was leased before the slab was poured.
The difficulty is that both the bull and the bear case assume someone can tell. They are arguments about whether demand will arrive, conducted as though the arrival would be observable. The same report that produced the 76% figure also reported that about 30% of S&P 500 companies claimed some quantifiable impact from AI while roughly 2% reported an actual tracked metric, and that as of April 2026 barely 2% of U.S. households were paying for any AI service at all.1 Those are not bearish numbers exactly. They are something more awkward. They say the instrumentation did not exist.
That gap is the most interesting thing in the whole period, and it is worth being fair about where it came from. The firm that published the 2% household figure is a venture capital firm with a large position in the outcome, and it published the number that complicates its own thesis anyway, which is more than most participants managed. The problem was not concealment. It was that an industry had built a capital base of several hundred billion dollars a year on top of a demand signal nobody had instrumented, and the one signal everybody could see, the rental price of a 2020 processor, was measuring supply.
There is a familiar shape to this. An industry pours capital into an input, the input gets abundant, and the thing that was supposed to be the prize turns out to be the commodity while the scarce thing moves somewhere nobody was watching. Wall Street spent fifteen years buying latency by the nanosecond and found that when everyone is fast, speed stops being an advantage and becomes a cost of participation. The pattern repeats because each round of it is individually rational: nobody can afford to be the only participant without the input.
A price tells you what the marginal buyer paid. It does not tell you whether the buyer had a use. When every unit of capacity sells out, a shortage and an absence of measurement produce exactly the same chart, and the longer the shortage runs the less anyone needs to build the measurement, because the capacity clears regardless. Scarcity is a wonderful excuse not to ask what the thing is for. The companies that came out of the decade best were generally not the ones that called the cycle correctly. They were the ones that could say, with a number, what a given unit of compute had done for them, and could therefore tell the difference between a price rising because the work was valuable and a price rising because there was not enough of it.
What would have counted as instrumentation is not mysterious, and a few organisations were already doing it. It means attaching a unit of compute to a unit of outcome: this many accelerator-hours produced this reduction in claims-handling time, this many fewer escalations, this much shorter a close. That is unglamorous accounting of exactly the kind the period was bad at, and it is harder than it sounds, because the gains usually show up in a function that did not pay for the compute. The firms that managed it tended to be ones with an existing metric they already trusted and could run against. The firms that did not were generally not hiding a bad result. They had layered a new capability onto a process designed around its absence, and then had no way to isolate what had changed.
So the card on the bench, scuffed from six years in a rack, did hold its value. It was read at the time as evidence that the demand underneath it ran deep. It is equally consistent with a simpler account, which is that nothing in the system had yet established what an hour of that card's time was worth, and a price that nobody can check against an outcome is not a valuation. It is a queue, priced.
Author's Note
This article is speculative journalism written from 2036. Every 2026 figure cited here, including the 76% earnings-growth share, the A100 rental observation, the 30% and 2% enterprise figures, the 2% household figure, the $697 billion capex projection, the 95% loan-to-cost financing and the FactSet earnings figures, is drawn from the published sources listed below and is reported as those sources state it. The 2036 vantage, the photograph of shell capacity outside Abilene, the characterisation of which firms came out of the decade best, and the reading of depreciation schedules as a discipline rather than an accounting formality are the author's. The historical parallels to the 1840s railway mania and the 2000 fibre buildout are offered as analogies, not as predictions.