

The machines did not blow up because they were wrong about the market. They blew up because, for the first time, they all agreed about it.
I spent years reading the portfolio-math literature as a plumbing story. Better pipes, cleaner water, nothing to see. Every optimizer since Harry Markowitz wrote the arithmetic down in 1952 needs three things: a guess at what each asset will earn, a map of how the assets move together, and the weights that fall out.1 I watched the map get accurate. I did not ask what happens when everyone holds the same map. Wrong question, wrong decade.
What the cleaning was for
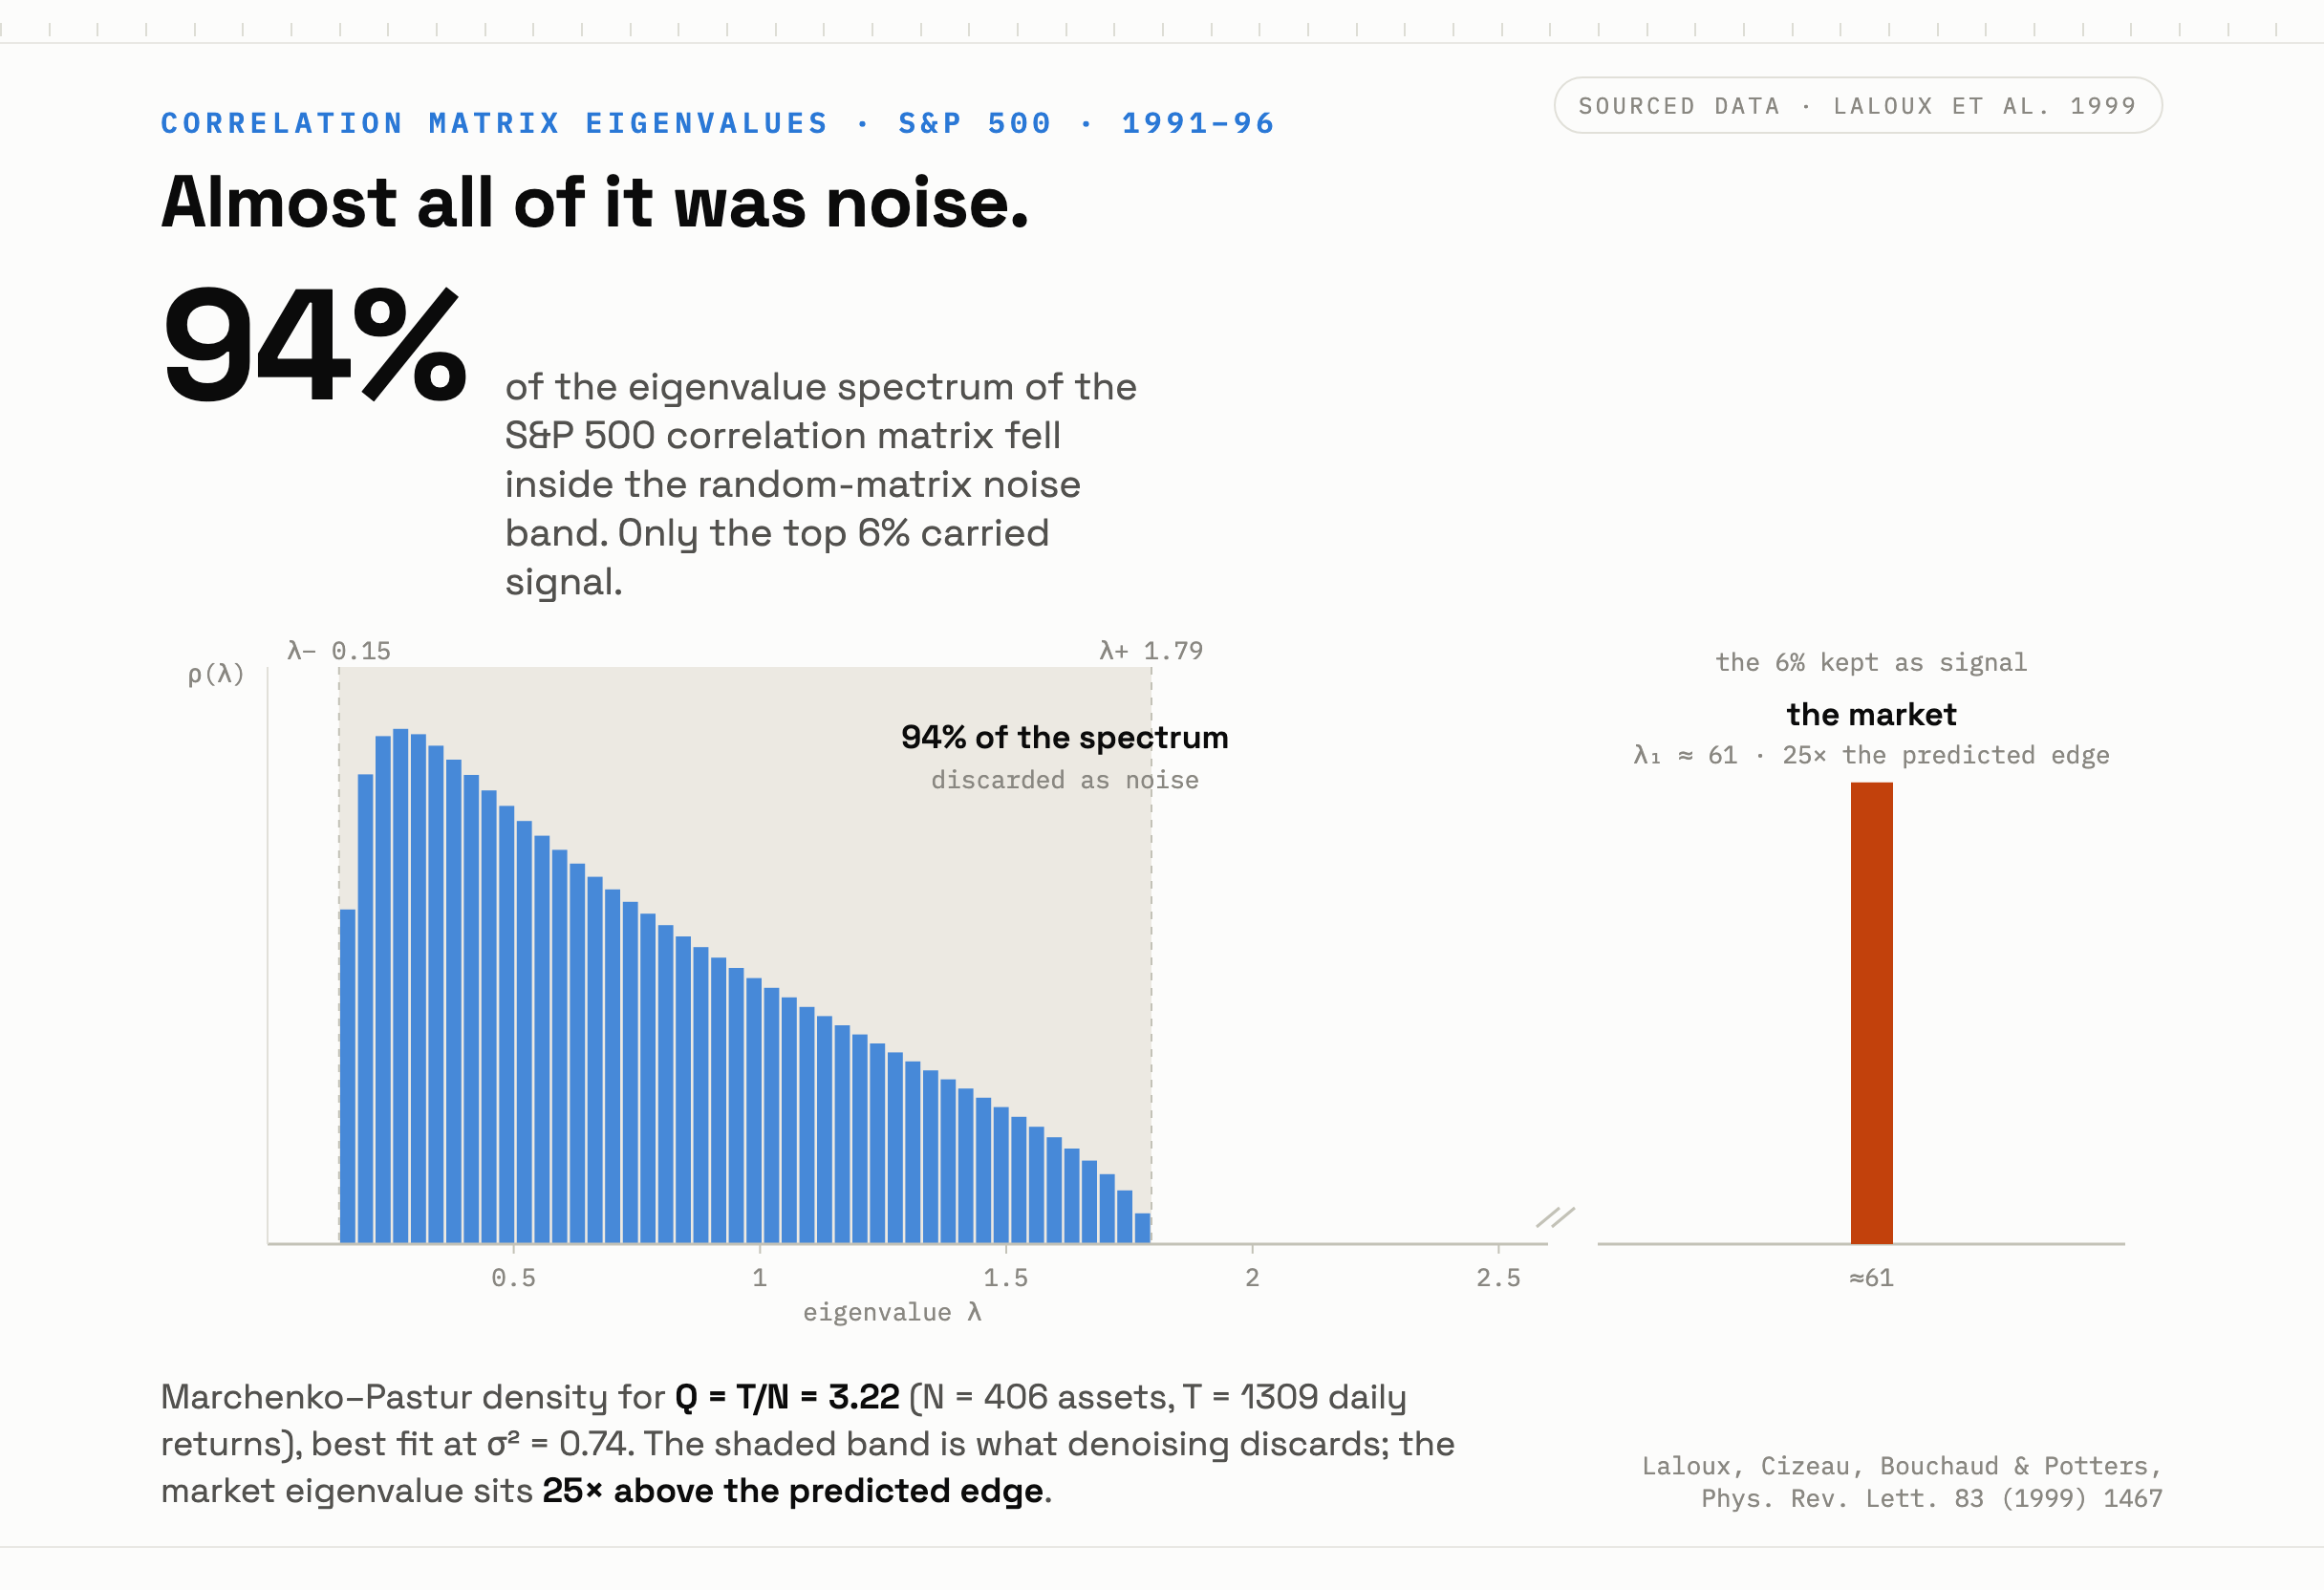
A covariance matrix estimated from real prices is mostly garbage. In 1999 four physicists put a number on it: roughly 94 percent of the eigenvalue spectrum of the S&P 500's correlation matrix was statistically indistinguishable from random noise.2 Invert a matrix like that and the noise comes back amplified, which is why the most elegant tool in portfolio math spent fifty years losing to a coin flip. Across fourteen optimisation models and seven datasets, DeMiguel, Garlappi and Uppal found none that consistently beat splitting your money evenly. To beat an even split reliably, a twenty-five-asset portfolio would need roughly three thousand months of history.4 Two hundred and fifty years to justify the arithmetic everyone was already using.
This was not an academic irritation. OECD pension assets reached 61.5 trillion dollars at the end of 2024, about 92 percent of the area's GDP, most of it allocated by some descendant of the same crank.3 A noisy matrix does not fail loudly. It quietly concentrates a retirement into positions nobody chose.
Then random matrix theory produced a recipe. Work out which eigenvalues fall inside the band pure noise would produce, flatten those, keep the rest. Marcos López de Prado turned it into working machinery, including a clustering method that builds a portfolio without inverting the matrix at all.5 Denoised matrices produced portfolios with materially lower out-of-sample volatility than the raw ones.6 That concedes a great deal, and I want to be plain about it. On any single desk, the cleaned number was better. Genuinely, measurably better.
The part nobody priced
That was the end of a fifty-year problem, and I read it as an ending. It was a beginning, filed under a different heading.
Here is what the single-desk view misses. There is only one right way to clean a matrix.
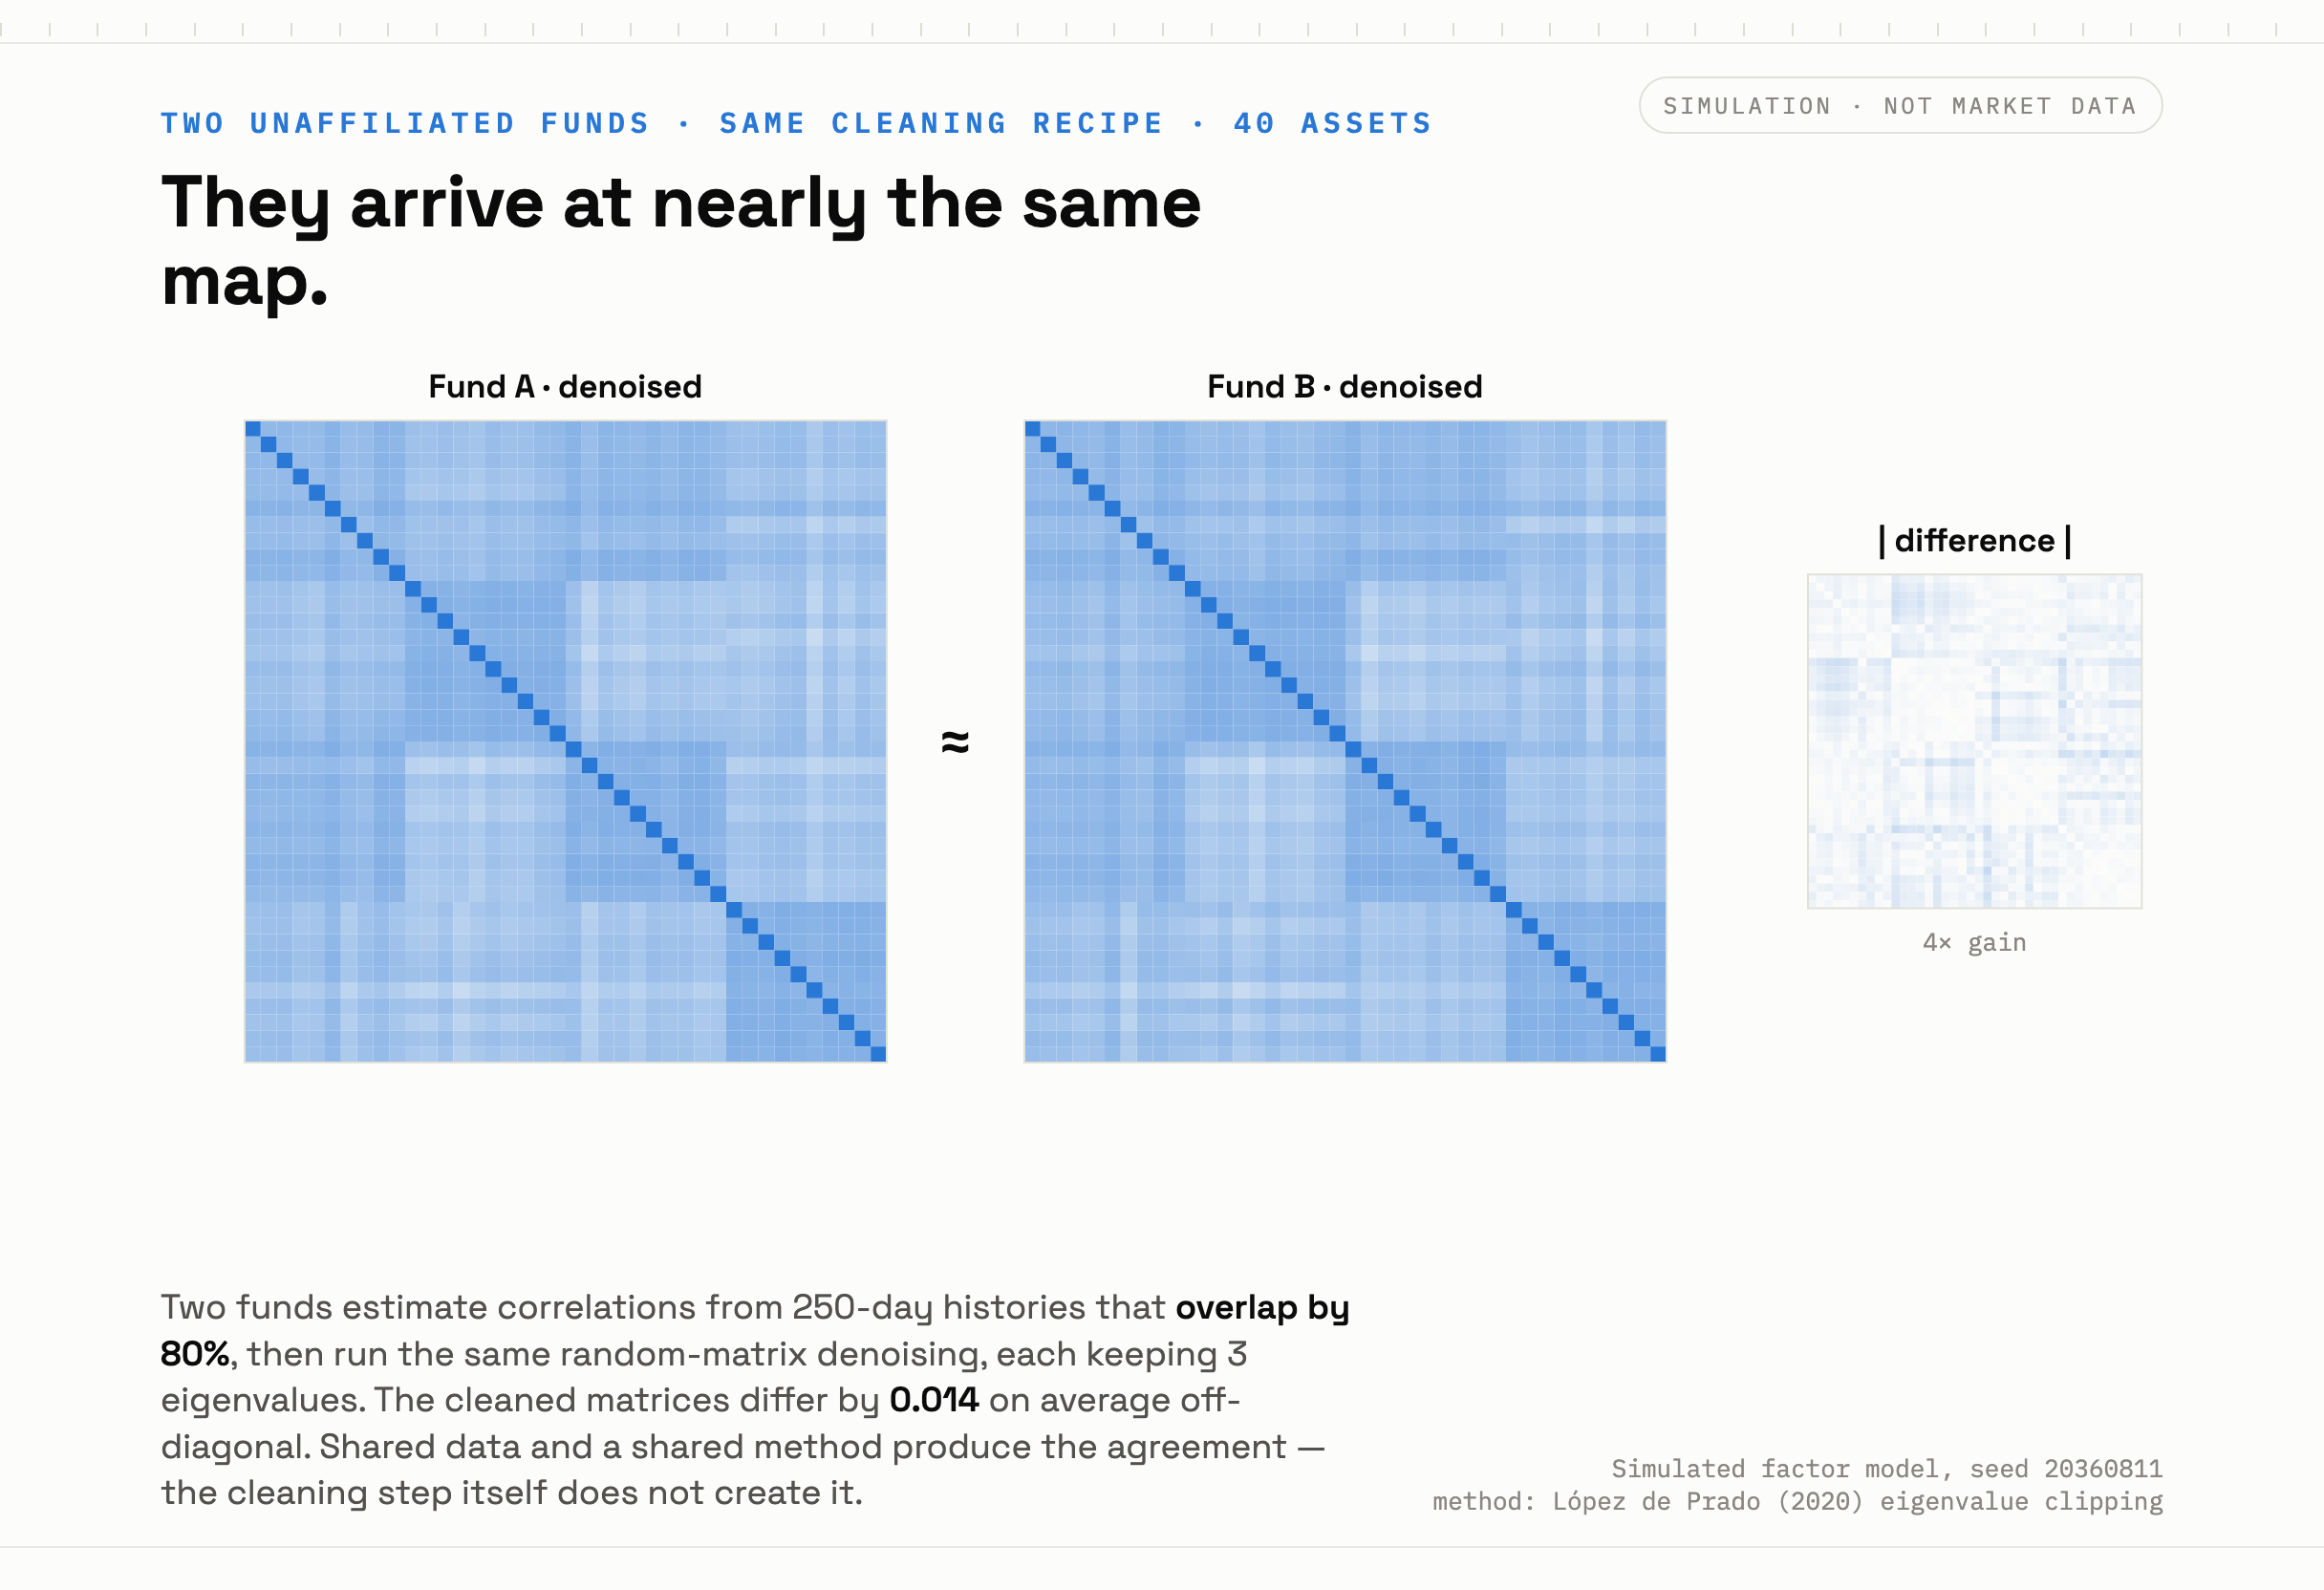
The noise band is defined by the same theory for everyone. The market factor, the largest eigenvalue, sticks out the same way in everyone's data because it is the same market.7 The clustering algorithms group the same assets, because the assets really do behave that way. By the early 2030s the convergence was visible in the products. Quant shops that had spent years building AI to master correlations and forecast regime shifts were arriving, without meaning to, at a shared picture of how the world was wired.8 It did not come from copying positions. It came from upstream: shared data and shared model architectures producing shared conclusions.9 Copying is a behaviour a compliance officer can look for. Convergence is a property of the inputs, and nothing in a fund's own records shows it. Two firms can share no staff and no positions and still hold the same view of how the world moves, because they bought the same history and applied the same published method.
Be exact here, because the obvious version of this story is wrong in a way that flatters my argument. Denoising does not by itself drag two funds toward the same answer. Run it on two independent samples and the cleaned matrices sit about as far apart as the raw ones did. What collapses the distance is the shared input: overlapping price histories, the same vendor feeds, the same published recipe applied on top. By the time you clean, the agreement has already happened. Cleaning removes the last thing that was hiding it.
Estimation error is noise, and noise is also dispersion, and markets clear on dispersion. A price is the point where one book's estimate of risk stops matching another's, and the trade happens in that gap. For most of a century the gap was wide enough that nobody had to name it. Strip the error out and you have not made the funds agree. You have revealed that they already did, and removed the last thing that let them trade with each other on the way down.
Now think about what a correlation of 0.2 between two assets is supposed to promise. When one falls, the other probably will not, so holding both is safer than holding either. That promise only holds if the people on the other side of your trades have different views and different needs. If every large book has cleaned its way to the same 0.2 and built the same hedges on top of it, the number has stopped describing a market and started describing a consensus. Consensus moves as one.
The reversal
We have already seen the rehearsal. In August 2007 a set of quant equity funds running similar factors and similar risk models took sudden, brutal losses. The trigger came from an unrelated corner of finance, and the damage spread because the funds were built alike and deleveraged through the same narrow door at the same time.10 Amir Khandani and Andrew Lo reconstructed that week, and the finding worth carrying forward is this: the funds were not holding bad positions, and nothing in the wider market told them to sell. They were holding the same good positions as each other, and once one large book began unwinding, the exit priced as though it were the only one. The losses arrived over roughly three days and much of the damage reversed almost as fast, which is the signature of a crowding event rather than a repricing. Nobody had been wrong about the assets. They had been wrong about how many other people held them.
Two things changed after that. The models got better, which shortened the time between a signal and a trade. And the recipe went public, which meant the model you were competing against was in many cases a close relative of your own. In 2007 the funds resembled each other by accident, through factor intuitions arrived at separately. Later they resembled each other by construction, through one published method.
Look at where the pieces were filed. A 1999 measurement of eigenvalue noise sat in statistical physics.2 A table of pension balances sat in social policy.3 A trade-press story about funds buying AI to master correlations sat in vendor coverage.8 A 2026 preprint on algorithmic homogenisation sat in machine learning.9 Four drawers, four professions, four conferences, no shared reading list. Put them on one desk and they describe a single object: an industry that bought accuracy in parallel and got similarity as a side effect. Nobody called it shared-model crowding in 2026. The phrase is ours, applied backwards, and it was already loaded in the chamber.
Each fund made itself safer with a better number, and the market got more fragile because every fund used the same one.
The AI era did not fix the 2007 flaw so much as refine it. When every optimizer holds the same denoised matrix, every optimizer holds a version of the same portfolio, and every optimizer decides to reduce risk on the same signal. At that moment the low correlations the matrix reports are fiction. The selling itself couples the assets. Diversification that lives inside a shared model is one trade wearing many names, and it learns this about itself only on the way out.
What gets me is that each fund was behaving well. Each had a cleaner matrix, a lower estimated variance, a more defensible book than it would have had in 2015, and 61.5 trillion dollars of retirement money sits behind that improvement. The fragility was in none of the books. It was in the agreement between them, and no risk system was built to look there. Each model stopped at its edge.
The lesson
A correlation matrix is a photograph of a market that has already moved. Clean the photograph until it is sharp, hand the same sharp copy to everyone, and you have not removed the risk. You have moved it into the one place nobody was measuring, which is the space between the models, where the disagreements used to live.
None of this argues for worse numbers. A number's usefulness depends on who else is holding it, and no accuracy metric in common use in 2036 has a term for that. Measure the agreement, not just the error.
Author's Note: This is speculative journalism, written from an imagined 2036. The failure it describes is a projection, not a reported event. The underlying methods, findings, and the 2007 episode are real and sourced below. The convergence-into-fragility argument extends them forward; it is an argument, not a forecast. The correspondent's first person marks the difference between what was knowable in 2026 and what is obvious from 2036; it records changes of mind, not events.